. 2018 Aug 9;14(8):e1006242.
doi: 10.1371/journal.pcbi.1006242. eCollection 2018 Aug.

Phylogeny-corrected identification of microbial gene families relevant to human gut colonization

Affiliations

Phylogeny-corrected identification of microbial gene families relevant to human gut colonization

Patrick H Bradley et al. PLoS Comput Biol. .

Abstract

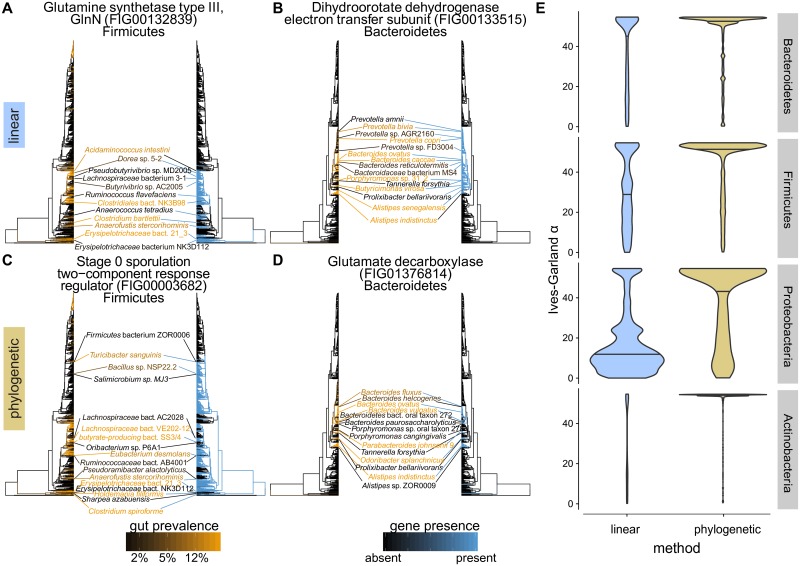
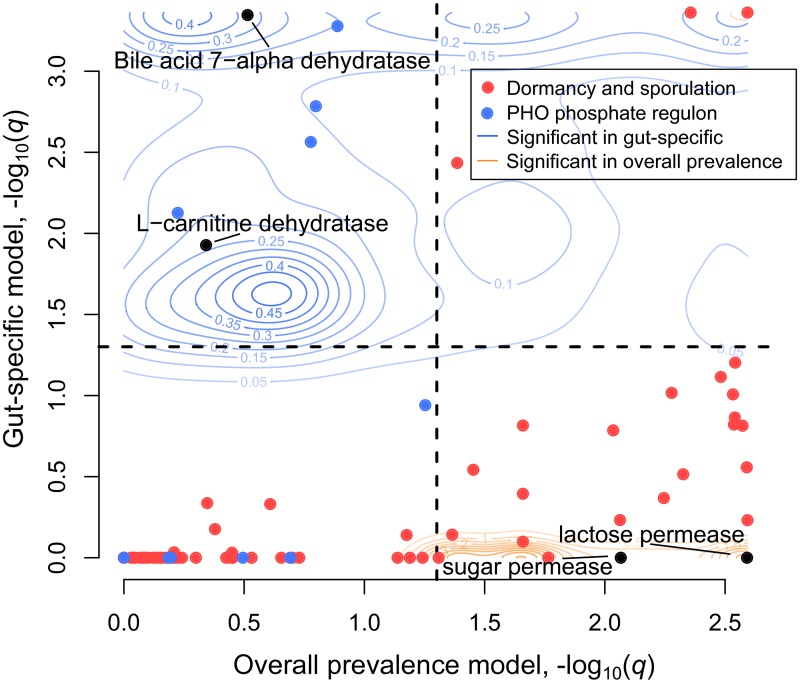
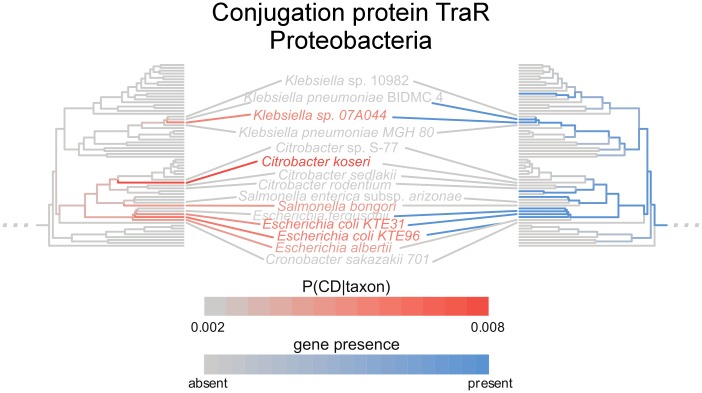
The mechanisms by which different microbes colonize the healthy human gut versus other body sites, the gut in disease states, or other environments remain largely unknown. Identifying microbial genes influencing fitness in the gut could lead to new ways to engineer probiotics or disrupt pathogenesis. We approach this problem by measuring the statistical association between a species having a gene and the probability that the species is present in the gut microbiome. The challenge is that closely related species tend to be jointly present or absent in the microbiome and also share many genes, only a subset of which are involved in gut adaptation. We show that this phylogenetic correlation indeed leads to many false discoveries and propose phylogenetic linear regression as a powerful solution. To apply this method across the bacterial tree of life, where most species have not been experimentally phenotyped, we use metagenomes from hundreds of people to quantify each species' prevalence in and specificity for the gut microbiome. This analysis reveals thousands of genes potentially involved in adaptation to the gut across species, including many novel candidates as well as processes known to contribute to fitness of gut bacteria, such as acid tolerance in Bacteroidetes and sporulation in Firmicutes. We also find microbial genes associated with a preference for the gut over other body sites, which are significantly enriched for genes linked to fitness in an in vivo competition experiment. Finally, we identify gene families associated with higher prevalence in patients with Crohn's disease, including Proteobacterial genes involved in conjugation and fimbria regulation, processes previously linked to inflammation. These gene targets may represent new avenues for modulating host colonization and disease. Our strategy of combining metagenomics with phylogenetic modeling is general and can be used to identify genes associated with adaptation to any environment.


Conflict of interest statement

The authors have declared that no competing interests exist.

Figures

Fig 1
Fig 1. Failing to account for tree structure results in an elevated false positive rate.
Continuous phenotypes and binary genotypes were simulated across the trees for the four phyla under consideration. A-D show results for the null of no true phenotype-genotype correlation. A-B) Histogram of p-values for simulated phenotypes and genotypes on the Bacteroidetes tree, using (A) phylogenetic or (B) standard linear models. The phylogenetic model distribution was similar to a uniform distribution, while the standard model was very anticonservative, having an excess of small p-values. C-D) False positive rates (Type I error rates) at p = 0.05 for the C) phylogenetic and D) standard models, across varying levels of true phylogenetic signal (Ives-Garland α). E) Traits with varying levels of “true” association spanning values we observed in real data were simulated, and power (y-axis) was computed using phylogenetic linear models.
Fig 2
Fig 2. Examples of hits from standard linear (blue highlights) and phylogenetic (orange highlights) models.
In each panel, the tree on the left is colored by species prevalence (black to orange), while the tree on the right is colored by gene presence-absence (blue to black). Selected species are displayed in the middle; lines link species with the leaves to which they refer. The color of the line matches the color of the leaf. A-B) The standard model recovered hits that matched large clades but without recapitulating fine structure. C-D) The phylogenetic model recovered associations for which more of the fine structure was mirrored between the left-hand and right-hand trees, as exemplified by the species labeled in the middle. E) Violin plots of Ives-Garland α, a summary of the rate of gain and loss of a binary trait across a tree, for genes significantly associated with prevalence in the standard (left, blue) and phylogenetic (right, orange) linear models. Horizontal lines mark the median of the distributions. The phylogenetic (orange) and standard linear (blue) models were significantly different for each phylum (Wilcox test for Bacteroidetes: 8.2 × 10−41; Firmicutes: 7.6 × 10−279; Proteobacteria: 1.8 × 10−235; Actinobacteria: 9.0 × 10−133).
Fig 3
Fig 3. Comparison of results from the overall prevalence and body-site specific models for Firmicutes.
FDR-corrected significance (as −log10(q)) of the overall model is plotted on the horizontal axis, whereas the same quantity for the body-site-specific model is plotted on the vertical axis. All FIGfams significant (q ≤ 0.05) in at least one of the two models are plotted as contour lines: FIGfams significant in the overall prevalence model (and possibly also the gut specific model) are plotted in orange, while FIGfams significant in the gut specific model (and possibly also the overall prevalence model) are plotted in blue. Selected SEED subsystems are displayed as colored points (legend), and selected individual genes are plotted as black points.
Fig 4
Fig 4. Genes involved in conjugative transfer are associated with Crohn’s disease-enriched species.
The conjugation transcriptional regulator traR is plotted as an example. The left-hand tree is colored by each species’ disease specificity score, i.e., the conditional probability of Crohn’s given the observation of a given species (grey, which represents the prior, to red, which represents a higher conditional probability). The right-hand tree is colored by gene presence-absence (grey, meaning absent, or blue, meaning present). The mirrored patterns drive the phylogeny-corrected correlation.

References

    1. Slack E, Hapfelmeier S, Stecher B, Velykoredko Y, Stoel M, Lawson MAE, et al. Innate and adaptive immunity cooperate flexibly to maintain host-microbiota mutualism. Science. 2009;325(5940):617–620. 10.1126/science.1172747 - DOI - PMC - PubMed
    1. Atarashi K, Tanoue T, Shima T, Imaoka A, Kuwahara T, Momose Y, et al. Induction of colonic regulatory T cells by indigenous Clostridium species. Science. 2011;331(6015):337–341. 10.1126/science.1198469 - DOI - PMC - PubMed
    1. Mazmanian SK, Round JL, Kasper DL. A microbial symbiosis factor prevents intestinal inflammatory disease. Nature. 2008;453(7195):620–625. 10.1038/nature07008 - DOI - PubMed
    1. Sassone-Corsi M, Raffatellu M. No vacancy: how beneficial microbes cooperate with immunity to provide colonization resistance to pathogens. Journal of Immunology. 2015;194(9):4081–7. 10.4049/jimmunol.1403169 - DOI - PMC - PubMed
    1. Yano JM, Yu K, Donaldson GP, Shastri GG, Ann P, Ma L, et al. Indigenous bacteria from the gut microbiota regulate host serotonin biosynthesis. Cell. 2015;161(2):264–76. 10.1016/j.cell.2015.02.047 - DOI - PMC - PubMed

Publication types