

Sociodemographic associations with abnormal estimated glomerular filtration rate (eGFR) in a large Canadian city: a cross-sectional observation study
- PMID: 30092764
- PMCID: PMC6085713
- DOI: 10.1186/s12882-018-0991-5
Sociodemographic associations with abnormal estimated glomerular filtration rate (eGFR) in a large Canadian city: a cross-sectional observation study
Abstract
Background: Chronic kidney disease (CKD) is often asymptomatic in its early stages but is indicated and is diagnosed with an estimated glomerular filtration rate (eGFR) < 60 ml/min/1.73m2. Certain sociodemographic groups are known to be at risk for CKD, but it is unclear if there are strong associations between these at risk groups with abnormal eGFR test results in Canada. Using only secondary laboratory and Census data, geospatial variation and sociodemographic associations with abnormal eGFR result rate were investigated in Calgary, Alberta.
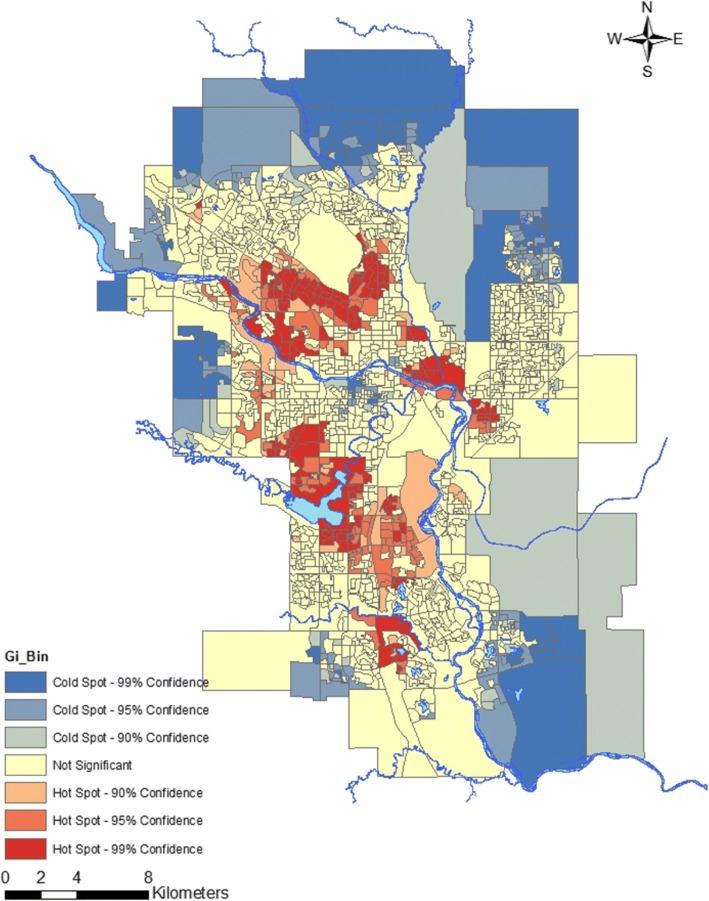
Methods: Secondary laboratory data from all adult community patients who received an eGFR test result were collected from Calgary Laboratory Service's Laboratory Information System, which is the sole supplier of laboratory services for the large metropolitan city. Group-level sociodemographic variables were inferred by combining laboratory data with the 2011 Canadian Census data. Poisson regression and relative risk (RR) were used to calculate associations between sociodemographic variables with abnormal eGFR. Geographical distribution of abnormal eGFR result rates were analyzed by geospatial analysis using ArcGIS.
Results: Of the 346,663 adult community patients who received an eGFR test result, 28,091 were abnormal (8.1%; eGFR < 60 ml/min/1.73m2). Geospatial analysis revealed distinct geographical variation in abnormal eGFR result rates in Calgary. Women (RR = 1.11, P < 0.0001), and the elderly (age ≥ 70 years; P < 0.0001) were significantly associated with an increased risk for CKD, while visible minority Chinese (RR = 0.73, P = 0.0011), South Asians (RR = 0.67, P < 0.0001) and those with a high median household income (RR = 0.88, P < 0.0001) had a significantly reduced risk for CKD.
Conclusions: Presented here are significant sociodemographic risk associations, and geospatial clustering of abnormal eGFR result rates in a large metropolitan Canadian city. Using solely publically available secondary laboratory and Census data, the results from this study aligns with known sociodemographic risk factors for CKD, as certain sociodemographic variables were at a higher risk for having an abnormal eGFR test result, while others were protective in this analysis.
Keywords: Census data; Chronic kidney disease; Estimated glomerular filtration rate; Geospatial mapping; Laboratory medicine.
Conflict of interest statement
Ethics approval and waiver of consent for this study was received from the University of Calgary Conjoint Health Research Ethics Board (Ethics ID REB 13–0862).
Not applicable.
The authors declare they have no competing interests.
Springer Nature remains neutral with regard to jurisdictional claims in published maps and institutional affiliations.
Figures
References
-
- Centers for Disease Control and Prevention. Chronic Kidney Disease Surveillance System - United States [Internet]. Vol. 2017. Available from: https://nccd.cdc.gov/CKD/. Accessed 29 Sept 2017.
-
- Manns B, McKenzie SQ, Flora A, Gignac PM, Geller LI, Canadians Seeking Solutions and Innovations to Overcome Chronic Kidney Disease (Can-SOLVE CKD) Network The financial impact of advanced kidney disease on Canada Pension Plan and private disability insurance costs. Can J Kidney Heal Dis. 2017;4:1–11. - PMC - PubMed
Publication types
MeSH terms
Grants and funding
LinkOut - more resources
Full Text Sources
Other Literature Sources
Medical
Research Materials
Miscellaneous
