. 2018 Oct:16:191-202.
doi: 10.1016/j.molmet.2018.07.002. Epub 2018 Jul 25.

Chronic d-serine supplementation impairs insulin secretion

Affiliations

Chronic d-serine supplementation impairs insulin secretion

Lisa Suwandhi et al. Mol Metab. 2018 Oct.

Abstract

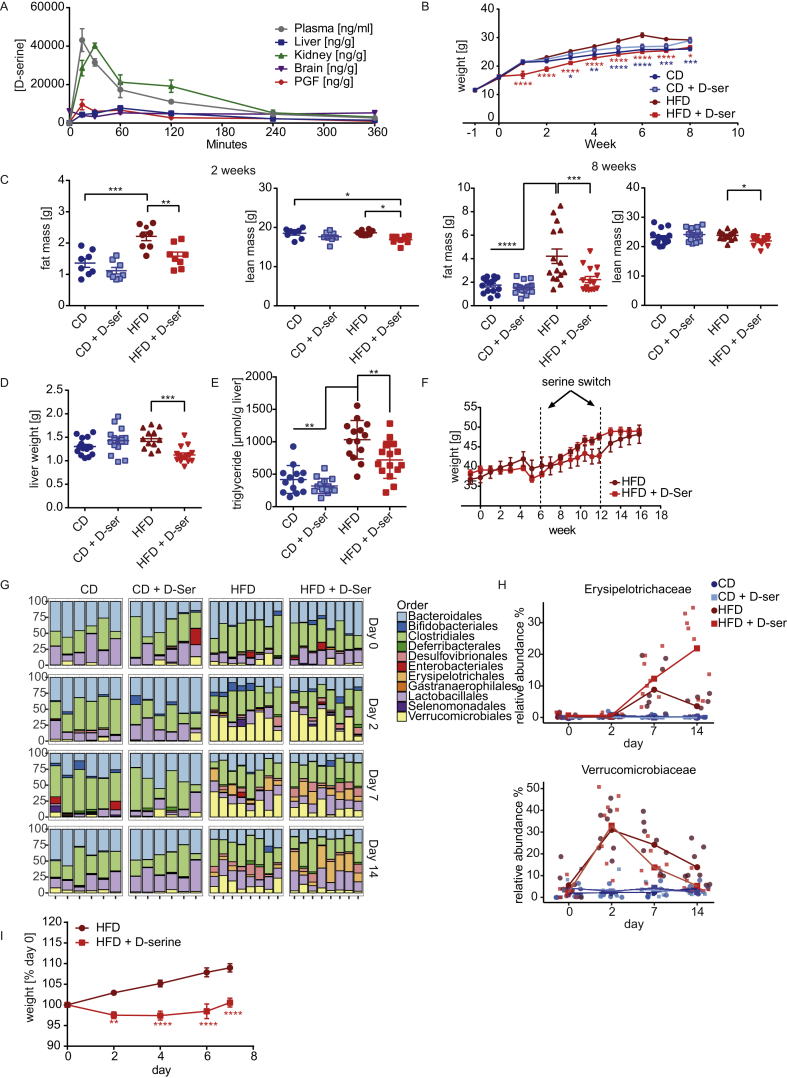
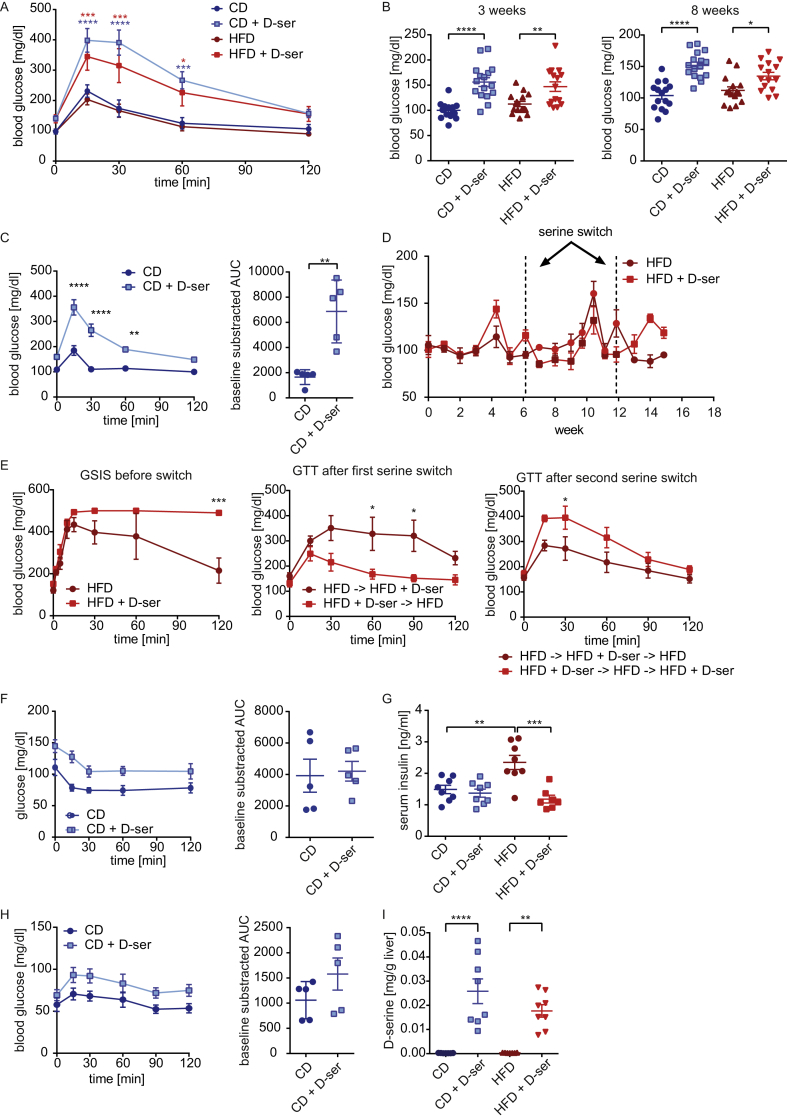
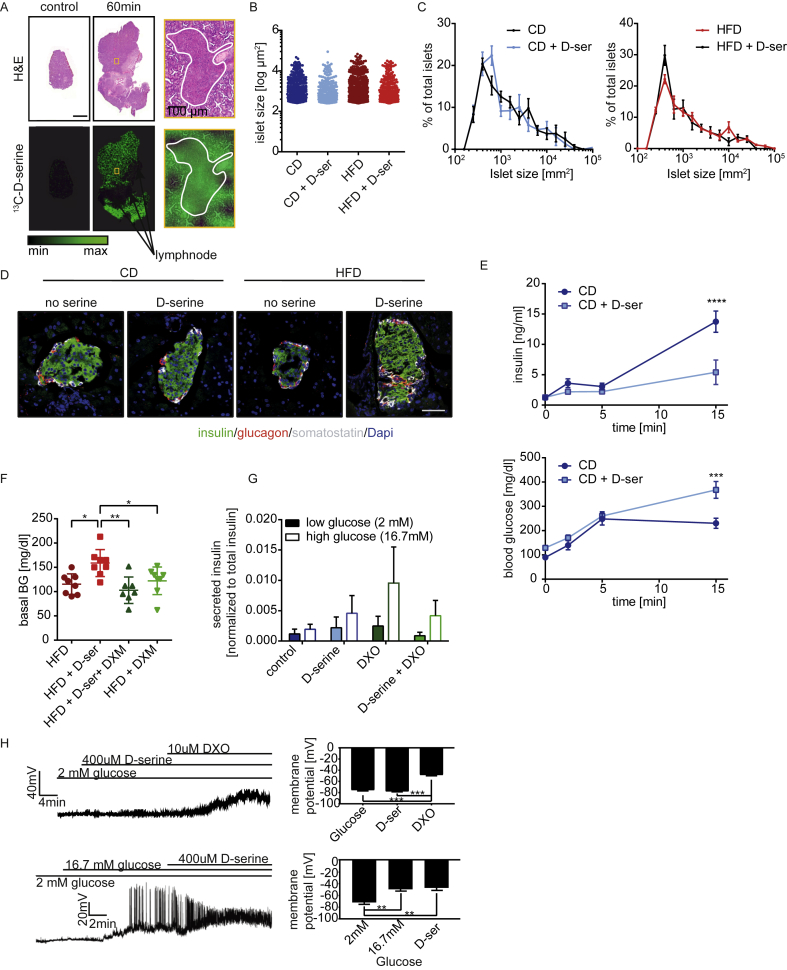
Objective: The metabolic role of d-serine, a non-proteinogenic NMDA receptor co-agonist, is poorly understood. Conversely, inhibition of pancreatic NMDA receptors as well as loss of the d-serine producing enzyme serine racemase have been shown to modulate insulin secretion. Thus, we aim to study the impact of chronic and acute d-serine supplementation on insulin secretion and other parameters of glucose homeostasis.

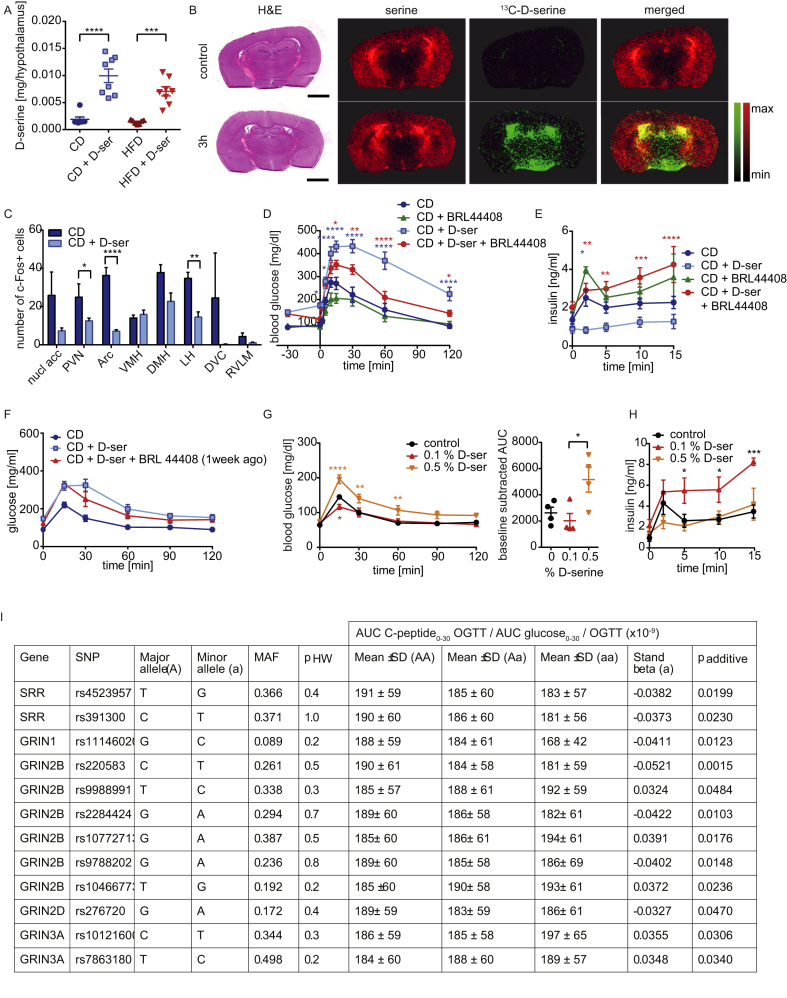
Methods: We apply MALDI FT-ICR mass spectrometry imaging, NMR based metabolomics, 16s rRNA gene sequencing of gut microbiota in combination with a detailed physiological characterization to unravel the metabolic action of d-serine in mice acutely and chronically treated with 1% d-serine in drinking water in combination with either chow or high fat diet feeding. Moreover, we identify SNPs in SRR, the enzyme converting L-to d-serine and two subunits of the NMDA receptor to associate with insulin secretion in humans, based on the analysis of 2760 non-diabetic Caucasian individuals.

Results: We show that chronic elevation of d-serine results in reduced high fat diet intake. In addition, d-serine leads to diet-independent hyperglycemia due to blunted insulin secretion from pancreatic beta cells. Inhibition of alpha 2-adrenergic receptors rapidly restores glycemia and glucose tolerance in d-serine supplemented mice. Moreover, we show that single nucleotide polymorphisms (SNPs) in SRR as well as in individual NMDAR subunits are associated with insulin secretion in humans.

Conclusion: Thus, we identify a novel role of d-serine in regulating systemic glucose metabolism through modulating insulin secretion.

Keywords: Diabetes; Insulin secretion; Obesity; d-serine.


Figures

Figure 1
Figure 1
d-serine regulates food preference and HFD induced weight gain. (A) 8 week old C57Bl/6 mice were gavaged with 100 mg d-serine/kg body weight or saline as controls. Mice gavaged with saline were used as controls and shown as time 0. Groups of four mice gavaged with d-serine were sacrificed after 15, 30, 60, 120, 240, and 360 min after administration and d-serine concentrations were measured by mass spectrometry. (B) Body weight curves of 4 week old C57Bl/6 mice fed a CD or HFD, and drinking water supplemented with or without 10 g/l d-serine throughout 8 weeks (n = 7–8). (C) Body composition after 2 and 8 weeks of serine supplementation (n = 7–16). (D) Liver weights after 8 weeks of treatment (n = 15–16). (E) Liver triglyceride content after 8 weeks of d-serine supplementation (n = 15–16). (F) Weight gain during 15 weeks of serine supplementation after 7 weeks on HFD (n = 4). After 6 and 12 weeks, the water bottles were switched. (G) Relative microbiota abundance at order level. The bar plot is displayed by treatment and day of intervention (n = 6–8). (H) Relative abundance dynamics of bacterial biomarkers Erysipelotrichaceae and Verrucomicrobiaceae (Akkermansia). (I) Weight gain in germfree C57Bl/6 mice fed with HFD with or without 1% d-serine supplementation (n = 5). Data are shown as mean ± SEM. Statistics were calculated either by one-way or two-way ANOVA with Tukey's or Sidak's (for germfree mice) multiple comparison post-hoc test (****P < 0.0001, ***P < 0.001, **P < 0.01, *P < 0.05).
Figure 2
Figure 2
d-serine supplementation impairs glucose but not insulin tolerance. (A) ipGTT after 6 weeks of d-serine supplementation (n = 7–8). (B) Blood glucose levels after three (random fed) and eight (4 h fasted) weeks of d-serine supplementation (n = 15–16). (C) ipGTT after 2 weeks of d-serine supplementation (n = 5). (D) Random fed blood glucose levels during 15 weeks of d-serine supplementation following 8 weeks on HFD prior to d-serine supplementation (n = 4). At weeks 6 and 12, d-serine supplementation was switched. (E) ipGTT after 5 weeks of d-serine supplementation, 6 weeks after the first serine switch and 3 weeks after the second serine switch of the mice shown in (D). (F) Insulin tolerance test after 3 weeks of d-serine supplementation (n = 5). (G) Random fed serum insulin levels after 3 weeks of d-serine supplementation. (H) ipPTT after 5 weeks of d-serine supplementation (n = 5). (I) Liver d-serine levels after 8 weeks chronic d-serine supplementation (n = 7–8). Data are shown as mean ± SEM. Statistics were calculated either by t-test, one-way or two-way ANOVA with Tukey's or Sidaks (for Fig 2C and E, F, H) multiple comparison post-hoc test (****P < 0.0001, ***P < 0.001, **P < 0.01, *P < 0.05).
Figure 3
Figure 3
d-serine impairs insulin secretion but not islet morphology. (A) 4 week old C57Bl/6 mice were gavaged with 10 mg/kg 13C-labeled d-serine and sacrificed after 60 min. Pancreata were prepared for MALDI FT-ICR MSI and stained with H&E. Control animals were gavaged with water. Size bar represents 2 mm. (B) Quantification of islet size and (C) islet size distribution (n = 4 per group) after 8 weeks of d-serine supplementation. (D) Representative triple staining of pancreatic islets after 3 weeks of serine supplementation. White: somatostatin. Red: glucagon. Green: insulin. Blue: Dapi. Size bar represents 50 μm. (E) Glucose stimulated insulin secretion after 4 weeks of serine supplementation (n = 5). (F) Blood glucose after one week on HFD +/− 10 g/l d-serine and 0.3% dextromethorphan in drinking water following a 4 h fast. (G) Glucose stimulated insulin secretion of isolated pancreatic islets pretreated with either 400 μM d-serine, 10 μM Dextrorphan tartrate (DXO) or a combination thereof for 1 h (n = 4). (H) Representative current-clamp trace of a mouse pancreatic β-cell displaying the electrical response to 400 μM d-serine and 10 μM DXO, in the presence of 2 or 16.7 mM glucose. The graph on the right shows mean membrane potential (n = 3–5). Values are mean ± SEM, analyzed by one-way or two-way ANOVA with Tukey's or Sidaks (for Fig 3E) multiple comparison post-hoc test (****P < 0.0001, ***P < 0.001, **P < 0.01, *P < 0.05).
Figure 4
Figure 4
α2-adrenergic receptor inhibition rescuesd-serine suppressed insulin secretion. (A) Hypothalamic d-serine levels after 8 weeks of d-serine supplementation. (B) 4 week old C57Bl/6 mice were gavaged with 10 mg/kg 13C-labeled d-serine and sacrificed after 3 h. Brains were prepared for MALDI FT-ICR MSI and stained with H&E staining. As negative control, animals were gavaged with water. Size bar represents 2 mm. (C) c-Fos expression in different brain regions after 6 weeks of d-serine supplementation (n = 1–3). Animals were fasted for 6 h prior to the experiment. (D) Glucose and (E) insulin levels during a GSIS after 2 and 4 weeks of d-serine supplementation +/− treatment with the α-adrenergic receptor inhibitor BRL 44408 (5 mg/kg) 30 min prior to glucose administration. (n = 5–10). (F) ipGTT after 3 weeks of d-serine supplementation and one week after a single injection of BRL 44408 (5 mg/kg) (n = 5). (G) ipGTT after 11 days of 0.1 or 0.5% d-serine supplementation (n = 4). (H) GSIS after 4 weeks of d-serine supplementation (n = 4). (I) Hardy–Weinberg equilibrium of genotype distribution analyzed by χ2-test (p HW). Genotype-phenotype association was assessed by multiple linear regression analysis (standard least squares method) in the additive inheritance model (p additive). Insulin secretion data adjusted for gender, age, BMI, and insulin sensitivity are derived from the linear regression models. The effect size of the minor allele is given as standardized beta. AUC – area under the curve; MAF – minor allele frequency; OGTT – oral glucose tolerance test; SD – standard deviation; SNP – single nucleotide polymorphism. Data are shown as mean ± SEM. Statistics were calculated using either ordinary one-way or two-way ANOVA with Tukey's multiple comparison post-hoc test (****P < 0.0001, ***P < 0.001, **P < 0.01, *P < 0.05).

References

    1. Billings L.K., Florez J.C. The genetics of type 2 diabetes: what have we learned from GWAS? Annals of the New York Academy of Sciences. 2010;1212:59–77. - PMC - PubMed
    1. Castillo J.J., Hazlett Z.S., Orlando R.A., Garver W.S. A global evolutionary and metabolic analysis of human obesity gene risk variants. Gene. 2017 Sep 5;627:412–419. - PMC - PubMed
    1. Ndiaye F.K., Ortalli A., Canouil M., Huyvaert M., Salazar-Cardozo C., Lecoeur C. Expression and functional assessment of candidate type 2 diabetes susceptibility genes identify four new genes contributing to human insulin secretion. Molecular Metabolism. 2017;6:459–470. - PMC - PubMed
    1. Guasch-Ferre M., Hruby A., Toledo E., Clish C.B., Martinez-Gonzalez M.A., Salas-Salvado J. Metabolomics in prediabetes and diabetes: a systematic review and meta-analysis. Diabetes Care. 2016;39:833–846. - PMC - PubMed
    1. Pallares-Mendez R., Aguilar-Salinas C.A., Cruz-Bautista I., Del Bosque-Plata L. Metabolomics in diabetes, a review. Annals of Medicine. 2016;48:89–102. - PubMed

Publication types

MeSH terms