

Comparison of a Photon-Counting-Detector CT with an Energy-Integrating-Detector CT for Temporal Bone Imaging: A Cadaveric Study
- PMID: 30093479
- PMCID: PMC6128765
- DOI: 10.3174/ajnr.A5768
Comparison of a Photon-Counting-Detector CT with an Energy-Integrating-Detector CT for Temporal Bone Imaging: A Cadaveric Study
Abstract
Background and purpose: Evaluating abnormalities of the temporal bone requires high-spatial-resolution CT imaging. Our aim was to assess the performance of photon-counting-detector ultra-high-resolution acquisitions for temporal bone imaging and compare the results with those of energy-integrating-detector ultra-high-resolution acquisitions.
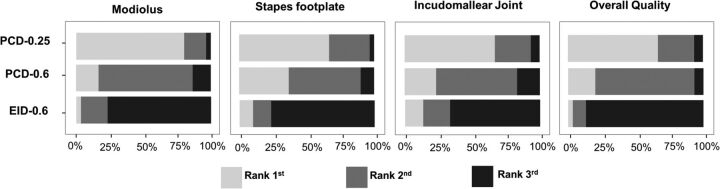
Materials and methods: Phantom studies were conducted to quantify spatial resolution of the ultra-high-resolution mode on a prototype photon-counting-detector CT scanner and an energy-integrating-detector CT scanner that uses a comb filter. Ten cadaveric temporal bones were scanned on both systems with the radiation dose matched to that of the clinical examinations. Images were reconstructed using a sharp kernel, 0.6-mm (minimum) thickness for energy-integrating-detector CT, and 0.6- and 0.25-mm (minimum) thicknesses for photon-counting-detector CT. Image noise was measured and compared using adjusted 1-way ANOVA. Images were reviewed blindly by 3 neuroradiologists to assess the incudomallear joint, stapes footplate, modiolus, and overall image quality. The ranking results for each specimen and protocol were compared using the Friedman test. The Krippendorff α was used for interreader agreement.
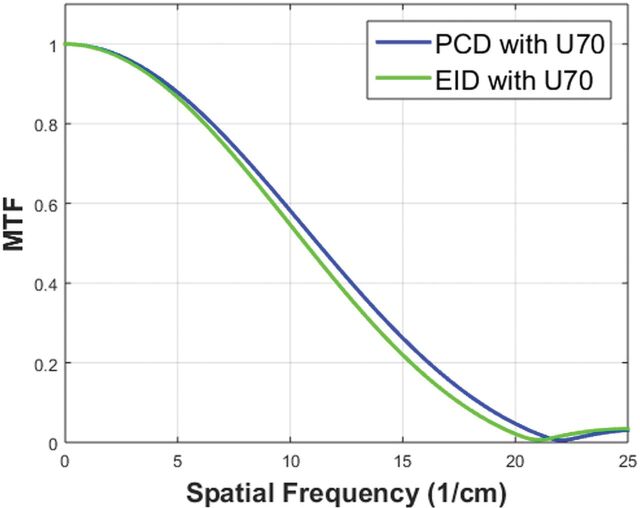
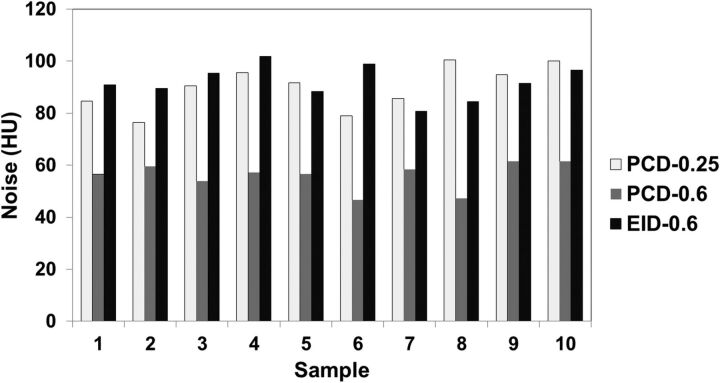
Results: Photon-counting-detector CT showed an increase of in-plane resolution compared with energy-integrating-detector CT. At the same thickness (0.6 mm), images from photon-counting-detector CT had significantly lower (P < .001) image noise compared with energy-integrating-detector CT. Readers preferred the photon-counting-detector CT images to the energy-integrating-detector images for all 3 temporal bone structures. A moderate interreader agreement was observed with the Krippendorff α = 0.50. For overall image quality, photon-counting-detector CT image sets were ranked significantly higher than images from energy-integrating-detector CT (P < .001).
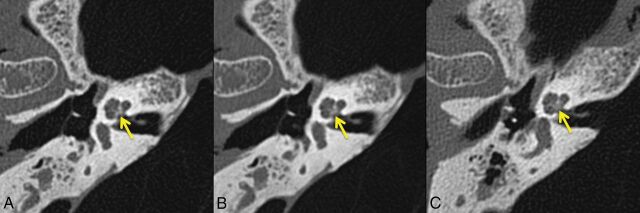
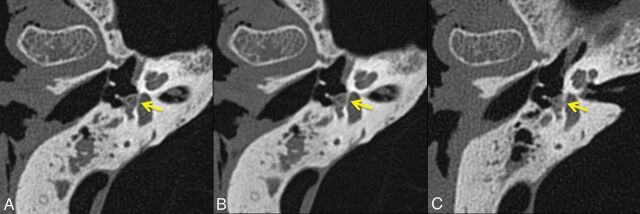
Conclusions: This study demonstrated substantially better delineation of fine anatomy for the temporal bones scanned with the ultra-high-resolution mode of photon-counting-detector CT compared with the ultra-high-resolution mode of a commercial energy-integrating-detector CT scanner.
© 2018 by American Journal of Neuroradiology.
Figures

References
Publication types
MeSH terms
Grants and funding
LinkOut - more resources
Full Text Sources
Other Literature Sources
Medical