. 2018 Aug 31;361(6405):eaat9804.
doi: 10.1126/science.aat9804. Epub 2018 Aug 9.

Developmental barcoding of whole mouse via homing CRISPR

Affiliations

Developmental barcoding of whole mouse via homing CRISPR

Reza Kalhor et al. Science. .

Abstract

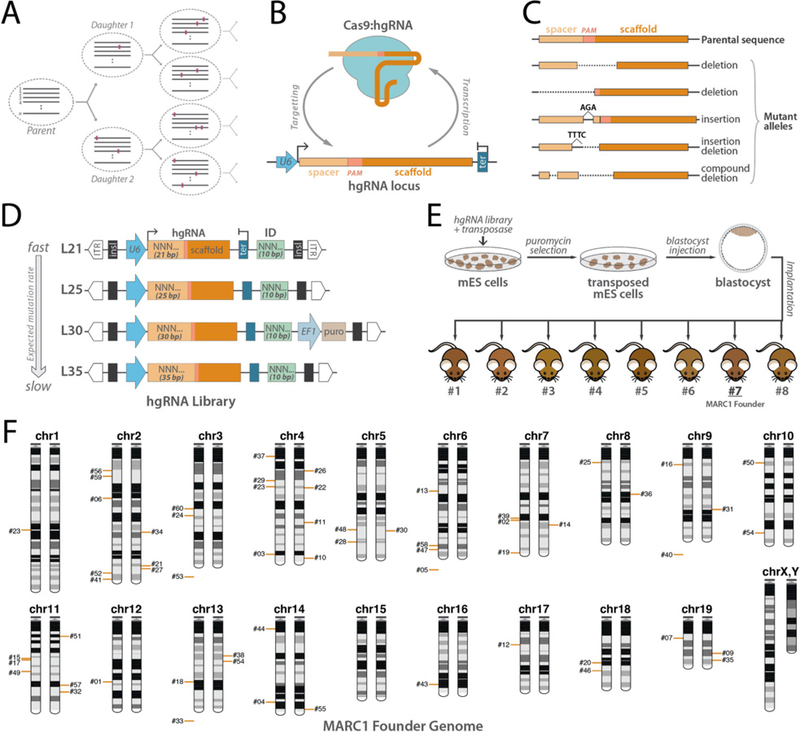
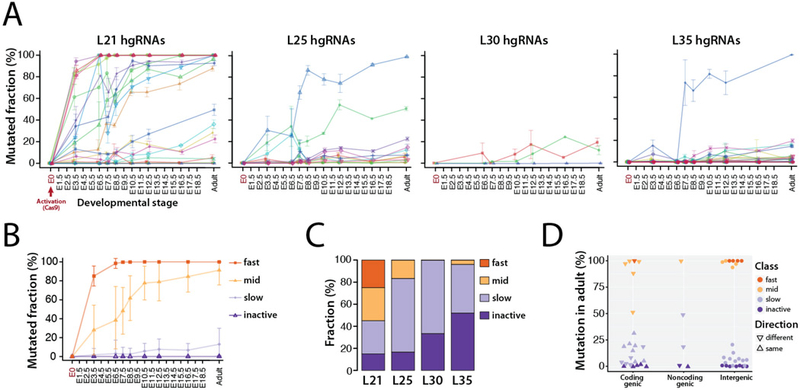
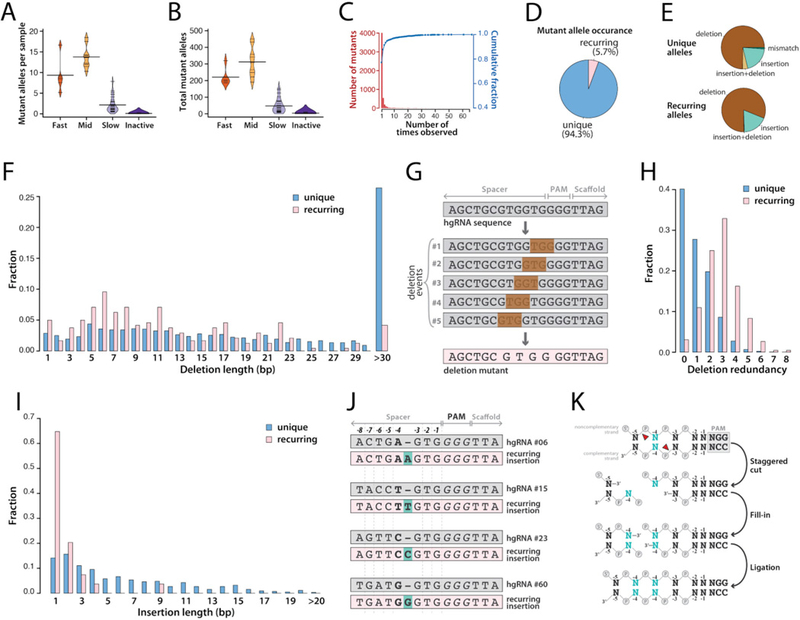
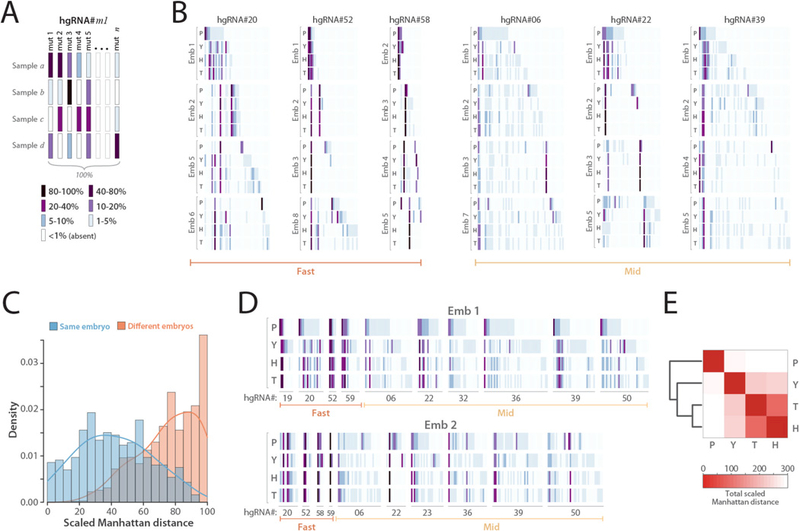
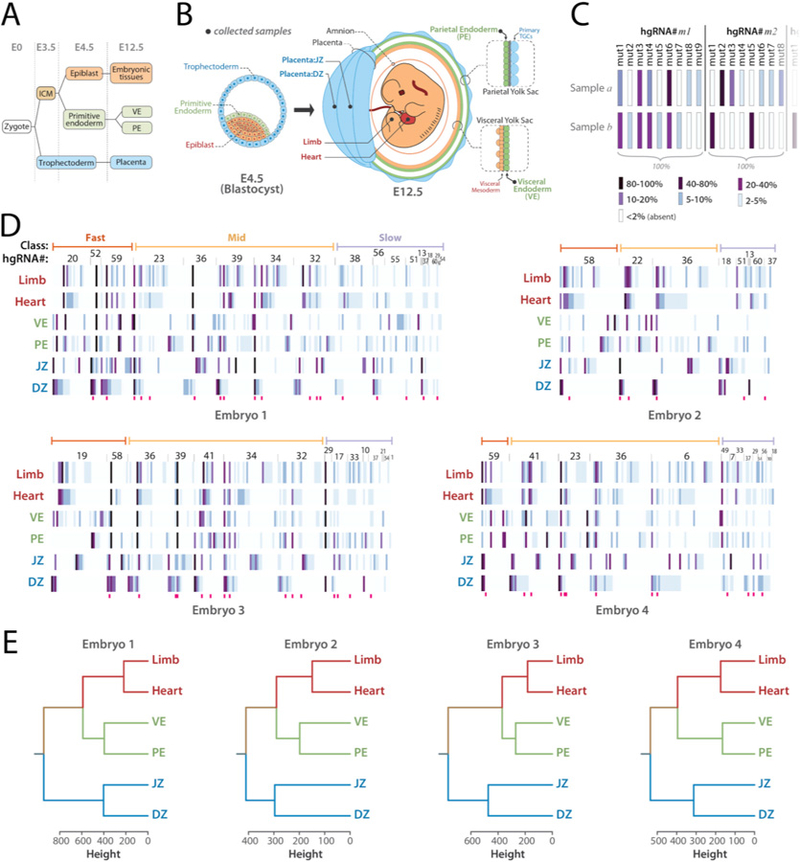
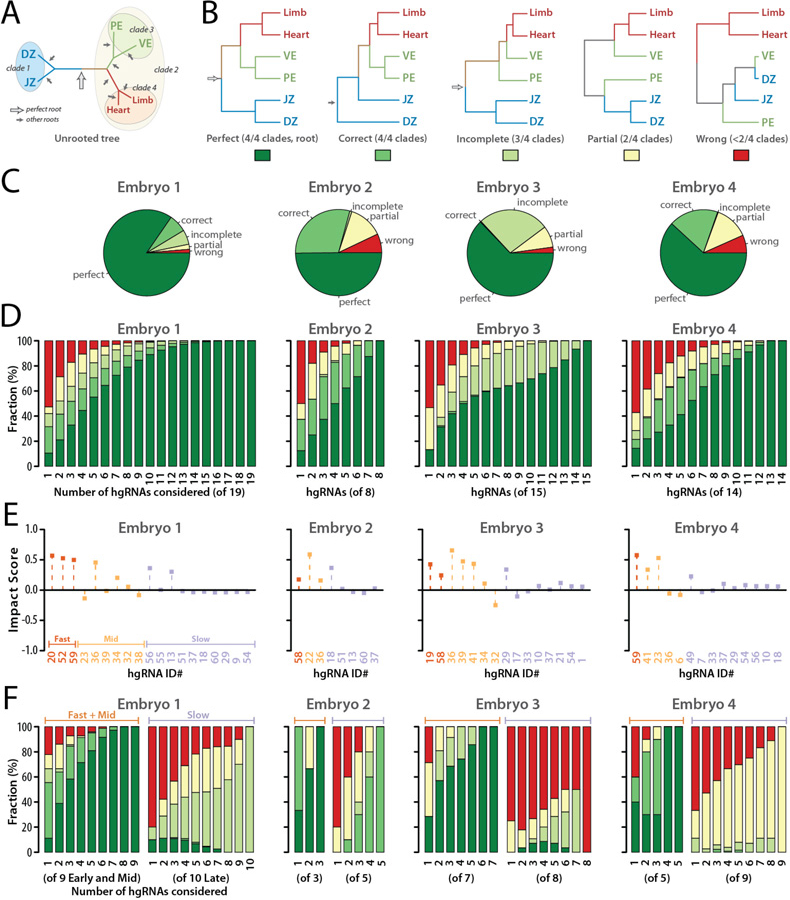
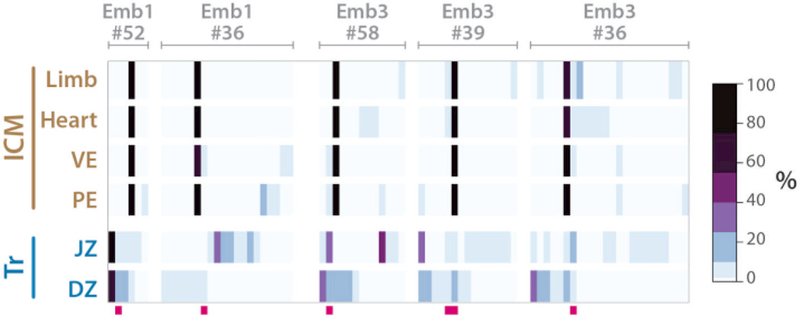
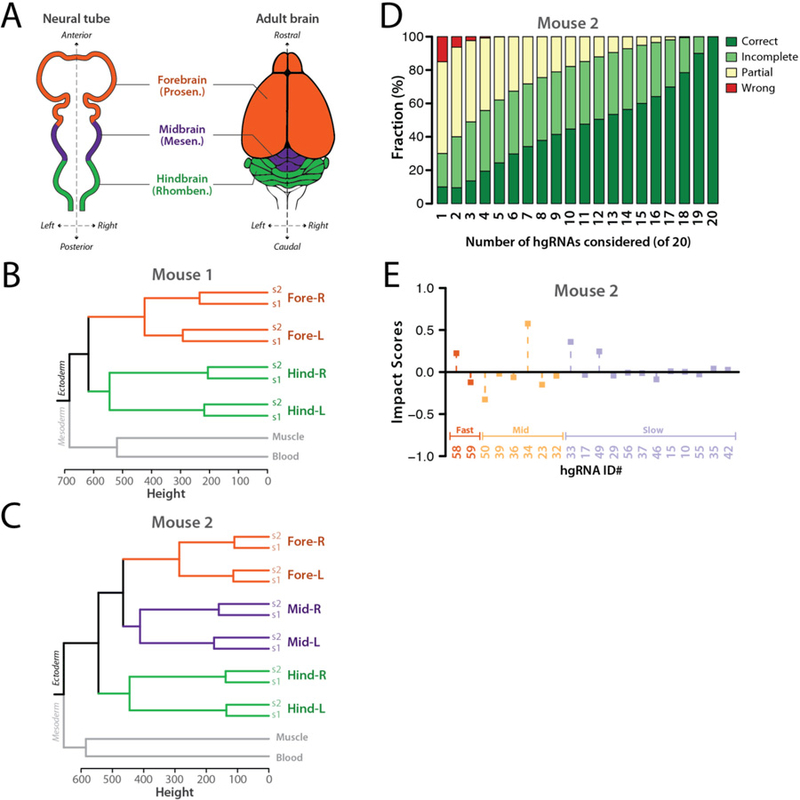
In vivo barcoding using nuclease-induced mutations is a powerful approach for recording biological information, including developmental lineages; however, its application in mammalian systems has been limited. We present in vivo barcoding in the mouse with multiple homing guide RNAs that each generate hundreds of mutant alleles and combine to produce an exponential diversity of barcodes. Activation upon conception and continued mutagenesis through gestation resulted in developmentally barcoded mice wherein information is recorded in lineage-specific mutations. We used these recordings for reliable post hoc reconstruction of the earliest lineages and investigation of axis development in the brain. Our results provide an enabling and versatile platform for in vivo barcoding and lineage tracing in a mammalian model system.


Figures

Fig. 1.
Fig. 1.. In vivo barcoding with hgRNAs and strategy to generate mouse with multiple hgRNA integrations.
(A) Recording lineages using synthetically-induced mutations in the genome. A number of loci(n) gradually accumulate heritable mutations as cells divide, thereby recording the lineage relationship of the cells in an array of mutational barcodes. Dashed ovals represent cells, gray lines represent an array of n mutating loci, and colored rectangles represent mutations. (B) Homing CRISPR system, in which the Cas9:hgRNA complex cuts the locus encoding the hgRNA itself. As the NHEJ repair system repairs the cut (Lieber and Wilson 2010), it introduces mutations in the hgRNA locus. (C) Example of mutations that are created in the hgRNA locus that can effectively act as barcodes. (D) Design of PiggyBac hgRNA library for creating transgenic mouse. Four hgRNA sub-libraries with 21, 25, 30, and 35 bases of distance between transcription start site (TSS) and scaffold PAM were constructed and combined. The spacer sequence (light orange box) and the identifier sequence (green box) were composed of degenerate bases. (E) Blastocyst injection strategy for producing hgRNA mice. The hgRNA library was transposed into mES cells. Cells with a high number of transpositions were enriched using puromycin selection and injected in E3.5 mouse blastocysts to obtain chimeras. Chimera #7 was chosen as the MARC1 founder. (F) Chromosomal position of all 54 hgRNAs whose genomic position was deciphered in the MARC1 founder (red bars). Bars on left or right copy of the chromosome indicate the hgRNAs that are linked on the same homologous copy. hgRNAs whose exact genomic position is not known but whose chromosome can be determined based on linkage are shown below the chromosome. ITR: PiggyBac Inverted Terminal Repeats; insl: insulator; U6: U6 promoter; ter: U6 terminator; ID: Identifier sequence; EF1: Human elongation factor-1 promoter; puro: puromycin resistance.
Fig. 2.
Fig. 2.. Activity of MARC1 hgRNAs.
(A) Activity profiles of all 60 hgRNAs in embryonic and adult progenies of MARC1 founder crossed with Cas9-knockin females, broken down by hgRNA length. The fraction of mutant (non-parental) spacer sequences in each hgRNA is measured. Lines connect the observed average mutation rates of one hgRNA. Mean ±SEM is shown (N is different for each value, see Table 2). See Table S2 for numerical values of the plot. (B) Average activity profiles of each hgRNA class in embryonic and adult progenies of MARC1 founder crossed with Cas9-knockin females. Mean ±SEM is shown as a representation of range of activity (N is different for each value, see Table 2). (C) Functional categorization of hgRNAs based on their activity profile in panel A, broken down by length. (D) Position and transcription direction of hgRNAs with respect to all known coding and non-coding genes, annotated for their functional category. See Table S3 for the genes hgRNAs are located in and fig. S3 for breakdown of this plot by hgRNA length.
Fig. 3.
Fig. 3.. Diversity of mutant hgRNA alleles in offspring of MARC1 x Cas9 cross.
(A) For each hgRNA category, beanplot of the number of mutant spacer alleles observed in each mouse. Short horizontal lines mark the average for each hgRNA in the category, long horizontal lines mark the average of all the hgRNAs in the category. See fig. S4A for a separate plot for each hgRNA. (B) Beanplots of the total number of mutant spacer alleles observed for each hgRNA in all mice. See fig. S4B for a separate plot for each hgRNA. (C) Histogram (red bars) and cumulative fraction (blue connected dots) of the number of mice each mutant allele was observed in, combined for all hgRNAs. See fig. S5 for a separate plot for each hgRNA. (D) Relative ratio of recurring mutant spacer alleles (fig. S5, Materials and Methods) to the unique alleles. (E) Mutation types in unique (top) and recurring (bottom) spacer alleles. See Table S4 and Table S5 for the sequences and alignment of all mutants and recurring mutants, respectively, and fig. S6 for a separate plot for each hgRNA. (F) Distribution of deletion length for unique and recurring mutant spacer alleles. Deletions larger than 30 bp have been aggregated. (G) Schematic representation of how five distinct deletion events can lead to the same mutant spacer allele. (H) Distribution of deletion redundancy, that is, the number of independent simple deletion events in the parental spacer allele that would lead to the same observed deletion mutant, for unique and recurring spacer alleles. Simple deletion is defined as deletion of a contiguous stretch of bases without creating insertions or mismatches. Redundancy of “0” represents non-simple mutant alleles, which involve insertions, mismatches, or non-contiguous deletions. (I) Distribution of insertion length for unique and recurring mutant spacer alleles. Insertions of 20 bp or longer have been aggregated. (J) Four observed examples of recurring single-base insertions, involving duplication of the −4 position, for four different hgRNAs. (K) Schematic representation of how a single-base staggered overhang generated by Cas9 can lead to duplication of the −4 position.
Fig. 4.
Fig. 4.. In vivo barcoding in mouse embryos.
(A) Barcode depiction for each hgRNA in each sample. Each column corresponds to an observed mutant spacer and each row corresponds to a sample. The color of each block represents the observed frequency of the corresponding mutant spacer in the corresponding sample. (B) In vivo-generated barcodes of three “fast” and three “mid” hgRNAs in eight embryos from a MARC1 x Cas9 cross. Four tissues were sampled from each embryo: the placenta (P), the yolk sac (Y), the head (H), and the tail (T). Embryos 1 and 2 were obtained at E16.5 whereas embryos 3 to 8 were obtained at E12.5 (Table 2). For each hgRNA, the results for a maximum of four embryos is shown. Full barcodes for all hgRNAs in fig. S7. The color code is as annotated in panel A. Only mutant alleles with a maximum abundance of more than 1% are shown. (C) Histogram of the scaled Manhattan distances (L1) between the barcodes of all possible sample pairs for each hgRNA, broken down by sample pairs belonging to the same embryo (blue) and pairs belonging to different embryos (orange). (D) The complete barcode, composed of the concatenation of all hgRNA barcodes, for embryo 1 and embryo 2. (E) Heatmap of the average Manhattan distance between the “full” barcodes of placenta, yolk sac, head, and tail samples in all eight embryos. For a separate map for each embryo see fig. S8.
Fig. 5.
Fig. 5.. Lineage derivation based on hgRNA-generated developmental barcodes.
(A) Summary of the earliest lineages in mouse. (B) Schematic representation of a blastocyst and an E12.5 mouse conceptus, color-coded based on the origin of tissues in blastocyst. Black dots show the positions and tissues of the samples obtained from E12.5 conceptuses. (C) Summary of how hgRNA barcodes were compiled for each sample. Each bar represents a mutant spacer of an hgRNA and its color represents its abundance relative to other mutant spacers of the same hgRNA in the same sample. (D) “Full” hgRNA barcodes for all samples from the four mouse embryos analyzed. The barcode is annotated in panel C. Only mutant alleles with a maximum abundance of more than 2% are shown. Deep pink bars below each map mark highly recurring alleles which have been observed in more than 60% of all mice analyzed in Table 2. See Table S6 for a numerical version of each barcode map. (E) Lineage tree for each embryo calculated from the full barcodes in panel D.
Fig. 6.
Fig. 6.. Lineage tree derivation robustness and contribution of each hgRNA.
(A) The correct unrooted tree topology for the earliest lineages in mouse. Arrows indicate all possible roots. The empty arrow indicates the perfect root. (B) The perfect rooted topology and an example from each of the other topology classifications. The colored boxes below each topology comprise the color key for the following panels of the Fig.. (C) For each of the four embryos analyzed, distribution of tree calculation outcomes from all possible subsets of hgRNAs (2n1 non-null subsets for an embryo with n hgRNAs). (D) Distribution of tree calculation outcomes when including only m of the n hgRNAs in each embryo (nCm combinations,1mn). Color code is as described in panel B. See also fig. S9 and fig. S10 for all combinations included and excluding each hgRNA. (E) Impact Score of each hgRNA in the early lineage tree of each embryo. (F) Distribution of tree calculation outcomes when only including k of the nfast+nmid fast and mid hgRNAs (left side of each panel, nfast+nmidCk combinations) or k of the nslow slow hgRNAs (right side of each panel, nslowCk combinations). Color code is as described in panel B.
Fig. 7.
Fig. 7.. Trophectoderm and ICM barcodes show differences in the number of mutant hgRNA alleles.
Five barcodes from two embryos in Fig. 5D that distinguish trophectoderm-derived and ICM-derived samples. Deep pink bars below each map mark highly recurring alleles which have been observed in more than 60% of all mice analyzed in Table 2. See Table S6 for a numerical version of each barcode map. Only mutant alleles with a maximum abundance of more than 2% are shown.
Fig. 8.
Fig. 8.. Anterior-posterior axis is established before the left-right axis in the development of the brain.
(A) Dorsal view of the neural tube and superior view of the adult brain in mouse. The primary brain vesicles in the neural tube and their corresponding structures in adult brain are shown. (B,C) Calculated trees based on hgRNA barcodes in two adult mice. See fig. S12 for the full barcodes. (D) Distribution of tree calculation outcomes for mouse 2 when only including m of the n hgRNAs in each mouse (nCm combinations). Only hgRNAs with at least 7% mutation rate in one of the samples were considered. (E) Impact Score of each hgRNA in the early lineage tree of mouse 2.

Comment in

References

    1. Kaufman MH, The Atlas of Mouse Development (1992).
    1. Sulston JE, Schierenberg E, White JG, Thomson JN, The embryonic cell lineage of the nematode Caenorhabditis elegans. Dev. Biol 100, 64–119 (1983). - PubMed
    1. Riddle DL, Blumenthal T, Meyer BJ, Priess JR, in C. elegans II 2nd edition (Cold Spring Harbor Laboratory Press, 1997). - PubMed
    1. Weisblat DA, Sawyer RT, Stent GS, Cell lineage analysis by intracellular injection of a tracer enzyme. Science 202, 1295–1298 (1978). - PubMed
    1. Walsh C, Cepko CL, Widespread dispersion of neuronal clones across functional regions of the cerebral cortex. Science 255, 434–440 (1992). - PubMed

Publication types

Substances