. 2018 Aug 9;9(1):3177.
doi: 10.1038/s41467-018-05610-w.

Plant and animal functional diversity drive mutualistic network assembly across an elevational gradient

Affiliations

Plant and animal functional diversity drive mutualistic network assembly across an elevational gradient

Jörg Albrecht et al. Nat Commun. .

Abstract

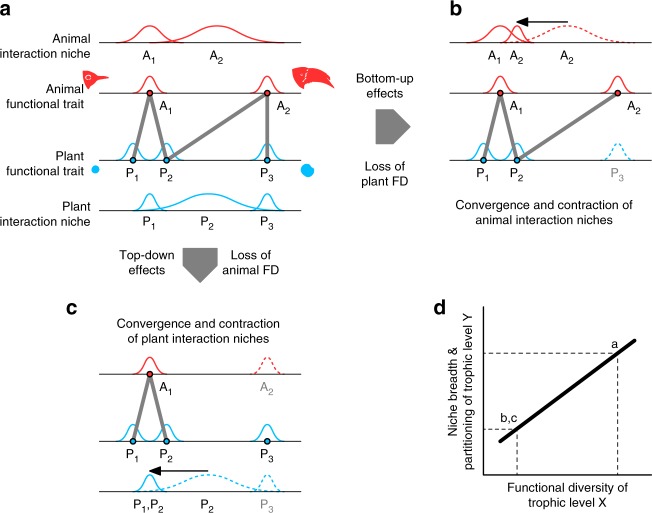
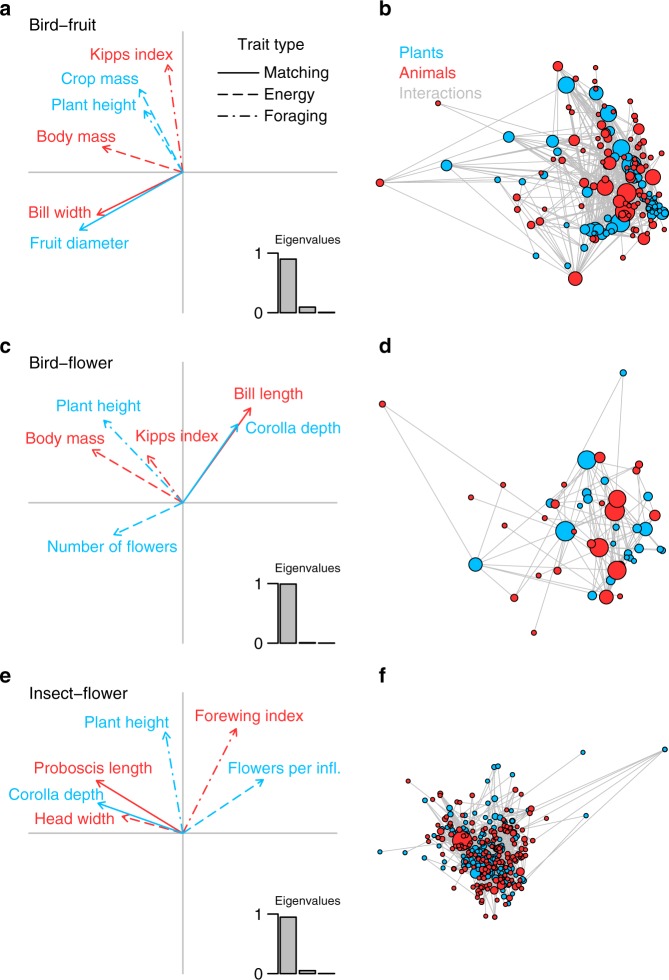
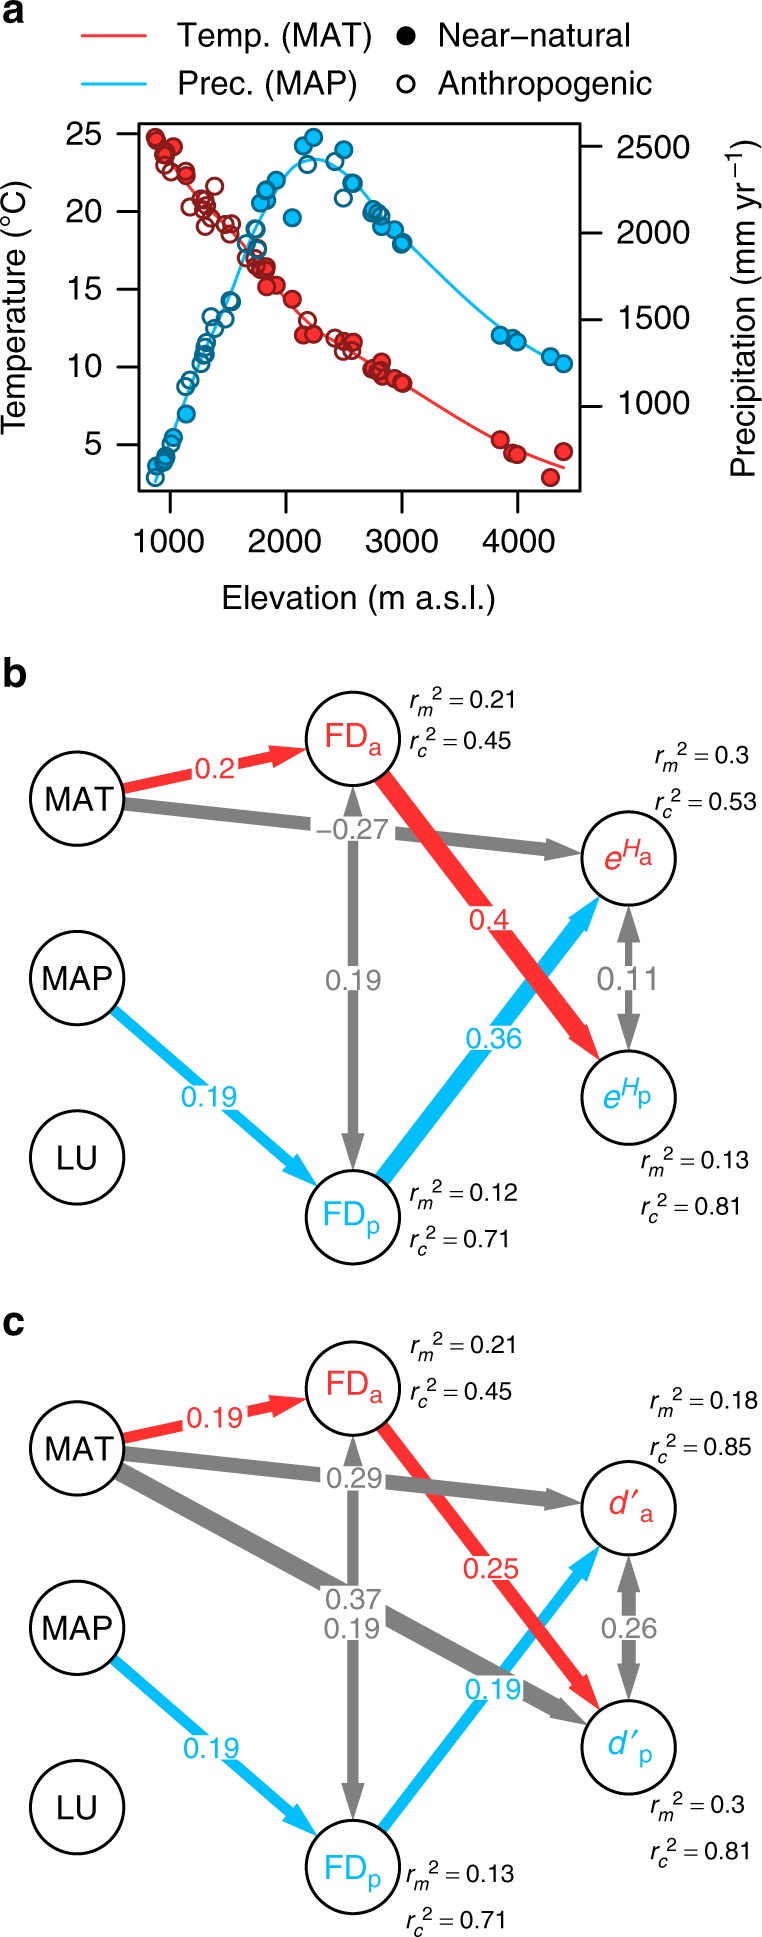
Species' functional traits set the blueprint for pair-wise interactions in ecological networks. Yet, it is unknown to what extent the functional diversity of plant and animal communities controls network assembly along environmental gradients in real-world ecosystems. Here we address this question with a unique dataset of mutualistic bird-fruit, bird-flower and insect-flower interaction networks and associated functional traits of 200 plant and 282 animal species sampled along broad climate and land-use gradients on Mt. Kilimanjaro. We show that plant functional diversity is mainly limited by precipitation, while animal functional diversity is primarily limited by temperature. Furthermore, shifts in plant and animal functional diversity along the elevational gradient control the niche breadth and partitioning of the respective other trophic level. These findings reveal that climatic constraints on the functional diversity of either plants or animals determine the relative importance of bottom-up and top-down control in plant-animal interaction networks.


Conflict of interest statement

The authors declare no competing interests.

Figures

Fig. 1
Fig. 1
Potential bottom-up and top-down effects of plant and animal functional diversity on the assembly of mutualistic networks. a Example of a mutualistic bird–fruit network, in which plants and animals are ordered along two corresponding size-matching trait axes according to bill and fruit size, respectively. The grey lines represent bird–fruit interactions, which are constrained by trait matching so that the small-billed bird can only consume small fruits, whereas the large-billed bird can also consume large fruits. Trait matching determines the realised interaction niches of plants and animals (represented on the trait axis of the other trophic level). b Removal of plant species P3 causes a loss of plant functional diversity and a contraction and convergence of the birds’ interaction niches corresponding to a reduction in niche breadth (diversity of a species’ interaction partners) and niche partitioning (complementary specialisation of several species on exclusive interaction partners; red histograms A1 and A2 at the top). c Likewise, removal of bird species A2 causes a loss of animal functional diversity and a contraction and convergence of plants’ interaction niches (blue histograms P1 and P2 at the bottom). d Consequently, a loss of functional diversity in one trophic level should cause a reciprocal reduction in niche breadth and partitioning in the other trophic level. Note that the convergence of interaction niches also implies that a reduction of functional diversity in one trophic level may cause increased competition for mutualistic partners in the other trophic level (e.g., between A1 and A2 in b or between P1 and P2 in c)
Fig. 2
Fig. 2
Associations of plant and animal functional traits in different types of plant–animal mutualistic networks. Results of a combination of RLQ and fourth-corner analyses for a, b bird–fruit, c, d bird–flower, and e, f insect–flower mutualisms. We use RLQ analysis (a, c, e) to map the multivariate trait space of animals on the multivariate trait space of plants based on plant–animal interaction networks. The eigenvalues of the RLQ analysis in a, c, e indicate the proportion of the cross-covariance between plant and animal trait spaces explained by each RLQ axis. Vectors in a, c, e depict the coefficients of plant (blue) and animal (red) traits on the first two axes of the plant and animal trait spaces from RLQ analysis. If two vectors are long and point into the same or opposite directions the absolute correlation coefficient between the corresponding traits is large. Different line types in a, c, e indicate different types of functional traits, related to size matching (continuous line), energy provisioning of plants and energy requirements of animals (long-dashed line), as well as foraging stratum and mobility (dash-dotted line). b, d, f Representation of the mutualistic networks in the multivariate trait spaces of plants and animals. Dots in b, d, f represent species scores of plants (blue) and animals (red) in their multivariate trait spaces and grey lines depict interactions between plants and animals. The size of the dots is proportional to the number of links that a species has (i.e., species degree)
Fig. 3
Fig. 3
Reciprocal bottom-up and top-down effects of functional diversity on the assembly of plant–animal mutualistic networks. a Variation in mean annual temperature (MAT [°C], red) and mean annual precipitation (MAP [mm yr−1], blue), as well as land use (LU; filled circles, near-natural habitats; open circles, anthropogenic habitats) along the elevational gradient of Mount Kilimanjaro, Tanzania. The Bayesian hierarchical structural equation models in b, c tested for direct and indirect ‘functional diversity’-mediated effects of mean annual temperature, mean annual precipitation and land use on (b) niche breadth (partner diversity, eH) and (c) niche partitioning (complementary specialisation, d′) of plants and animals via functional diversity of plant and animal communities (functional dispersion, FD; subscripts p and a for plants and animals, respectively). The lines in a represent loess smooth functions (degree = 2, span = 0.5) fitted to the temperature and precipitation data across the elevational gradient. In b, c only paths that were supported by the Bayesian variable selection (2loge(Bayes factor) > 2) are shown (see Supplementary Table 2). Path colours depict bottom-up-mediated effects (blue), top-down-mediated effects (red) and direct abiotic effects (grey) on network structure. Grey double-headed arrows depict covariance terms that account for correlated errors due to common unmeasured sources of variance and due to reciprocal effects of functional diversity on the other trophic level. Path widths are proportional to standardised effect sizes. The values near the endogenous variables depict the marginal (r2) variance explained by fixed factors only, as well as the conditional (rc2) variance explained by fixed and random factors combined (see Methods for details). Sample sizes are nobs = 126 observations, nsite = 53 study sites and nmutualism = 3 mutualisms

References

    1. Thompson JN. The coevolving web of life. Am. Nat. 2009;173:125–140. doi: 10.1086/595752. - DOI - PubMed
    1. Bascompte J, Jordano P. Plant-animal mutualistic networks: the architecture of biodiversity. Annu. Rev. Ecol. Evol. Syst. 2007;38:567–593. doi: 10.1146/annurev.ecolsys.38.091206.095818. - DOI
    1. Kremen C. Managing ecosystem services: what do we need to know about their ecology? Ecol. Lett. 2005;8:468–479. doi: 10.1111/j.1461-0248.2005.00751.x. - DOI - PubMed
    1. Vázquez DP, Blüthgen N, Cagnolo L, Chacoff NP. Uniting pattern and process in plant-animal mutualistic networks: a review. Ann. Bot. 2009;103:1445–1457. doi: 10.1093/aob/mcp057. - DOI - PMC - PubMed
    1. Hillebrand H, Matthiessen B. Biodiversity in a complex world: consolidation and progress in functional biodiversity research: consolidation and progress in BDEF research. Ecol. Lett. 2009;12:1405–1419. doi: 10.1111/j.1461-0248.2009.01388.x. - DOI - PubMed

Publication types

LinkOut - more resources