

Genome-wide association study identifies multiple new loci associated with Ewing sarcoma susceptibility
- PMID: 30093639
- PMCID: PMC6085378
- DOI: 10.1038/s41467-018-05537-2
Genome-wide association study identifies multiple new loci associated with Ewing sarcoma susceptibility
Abstract
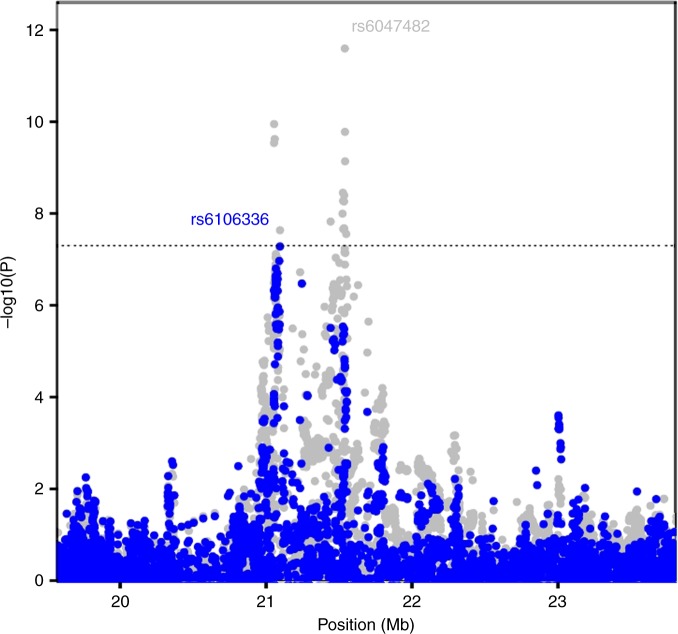
Ewing sarcoma (EWS) is a pediatric cancer characterized by the EWSR1-FLI1 fusion. We performed a genome-wide association study of 733 EWS cases and 1346 unaffected individuals of European ancestry. Our study replicates previously reported susceptibility loci at 1p36.22, 10q21.3 and 15q15.1, and identifies new loci at 6p25.1, 20p11.22 and 20p11.23. Effect estimates exhibit odds ratios in excess of 1.7, which is high for cancer GWAS, and striking in light of the rarity of EWS cases in familial cancer syndromes. Expression quantitative trait locus (eQTL) analyses identify candidate genes at 6p25.1 (RREB1) and 20p11.23 (KIZ). The 20p11.22 locus is near NKX2-2, a highly overexpressed gene in EWS. Interestingly, most loci reside near GGAA repeat sequences and may disrupt binding of the EWSR1-FLI1 fusion protein. The high locus to case discovery ratio from 733 EWS cases suggests a genetic architecture in which moderate risk SNPs constitute a significant fraction of risk.
Conflict of interest statement
The authors declare no competing interests.
Figures

References
-
- Aurias, A. et al. Chromosomal translocations in Ewing’s sarcoma. N. Engl. J. Med. 309, 496–498 (1983). - PubMed
Publication types
MeSH terms
Substances
Grants and funding
LinkOut - more resources
Full Text Sources
Other Literature Sources
Molecular Biology Databases
