. 2018 Jul 26:9:1571.
doi: 10.3389/fimmu.2018.01571. eCollection 2018.

Quantitative Measurement of Naïve T Cell Association With Dendritic Cells, FRCs, and Blood Vessels in Lymph Nodes

Affiliations

Quantitative Measurement of Naïve T Cell Association With Dendritic Cells, FRCs, and Blood Vessels in Lymph Nodes

Humayra Tasnim et al. Front Immunol. .

Abstract

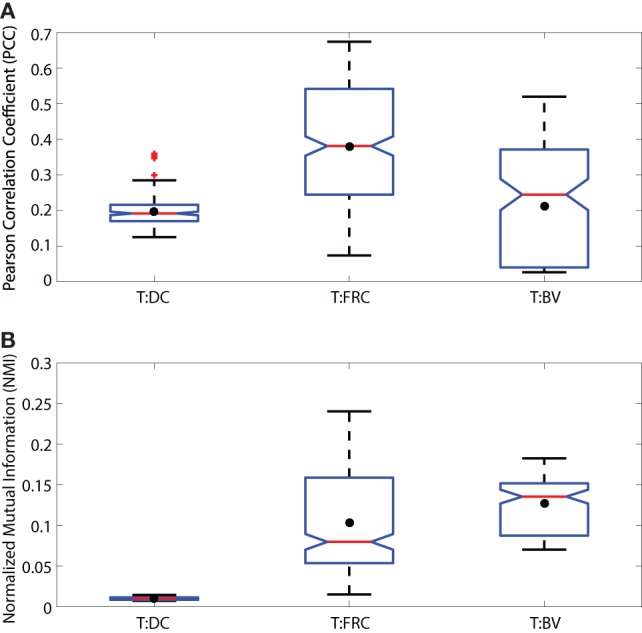
T cells play a vital role in eliminating pathogenic infections. To activate, naïve T cells search lymph nodes (LNs) for dendritic cells (DCs). Positioning and movement of T cells in LNs is influenced by chemokines including CCL21 as well as multiple cell types and structures in the LNs. Previous studies have suggested that T cell positioning facilitates DC colocalization leading to T:DC interaction. Despite the influence chemical signals, cells, and structures can have on naïve T cell positioning, relatively few studies have used quantitative measures to directly compare T cell interactions with key cell types. Here, we use Pearson correlation coefficient (PCC) and normalized mutual information (NMI) to quantify the extent to which naïve T cells spatially associate with DCs, fibroblastic reticular cells (FRCs), and blood vessels in LNs. We measure spatial associations in physiologically relevant regions. We find that T cells are more spatially associated with FRCs than with their ultimate targets, DCs. We also investigated the role of a key motility chemokine receptor, CCR7, on T cell colocalization with DCs. We find that CCR7 deficiency does not decrease naïve T cell association with DCs, in fact, CCR7-/- T cells show slightly higher DC association compared with wild type T cells. By revealing these associations, we gain insights into factors that drive T cell localization, potentially affecting the timing of productive T:DC interactions and T cell activation.

Keywords: CCR7; FRCs; T cells; dendritic cells; lymph nodes; mutual information.


Figures

Figure 1
Figure 1
Notched boxplots displaying PCC (A) and NMI (B) values for T:DC, T:FRC, and T:BV images. Data include 6 T:DC image z-stacks (2 experiments on 2 different days, 2 mice, 4 lymph nodes), 12 T:FRC image z-stacks (3 experiments on 3 different days, 6 lymph nodes), 4 T:BV image z-stacks (2 mice on 2 different days, 3 lymph nodes). Black dots indicate the mean. Median T:DC PCC value = 0.1922, median T:FRCs PCC value = 0.3810, median T:BV PCC value = 0.2447. Mann–Whitney p values for T:DC–T:FRCs < e−4, T:DC–T:BV = 0.0293, and T:FRC-T:BV < e−4. Median T:DC NMI value = 0.0101, median T:FRC NMI value = 0.0798, and median T:BV NMI value = 0.1355. Mann–Whitney p values for T:DC–T:FRC, T:DC–T:BV, and T:FRC-T:BV comparisons < e−4.
Figure 2
Figure 2
Illustration of low, medium and high MI. Simulated images of 500 red and 500 green cells are shown in panels (A–C). Each cell is a square of 11 × 11 pixels. The location and color intensity of each green cell is chosen from a uniform random distribution. A red cell is paired with each green cell. The red cell has the same color intensity as the green cell, but with a different spatial association in each case. In panel (A), red cells are placed at random locations uncorrelated with green cell placements. In panel (B), the placements of red and green cells are partially correlated. Red cell locations are chosen from a Gaussian distribution centered at the location of the paired green cell, but with a standard deviation (σ = 5). In panel (C), the location of red and green cells is identical (σ = 0). (D–F) Set diagrams indicating the shared information between red and green channels. In panel (D), the two color channels are independent since cell locations are uncorrelated with each other providing minimum MI. In panel (E), the two images are partially correlated which increases the MI, shown by the yellow shaded region. In panel (F), the two images are completely correlated maximizing the MI of the two color channels, resulting in complete intersection of the information in the red and green channels (yellow region). Panels (G–I) joint probability tables for images (A–C) where 256 color intensities are binned into 4 color intensities for purposes of illustration, resulting in a 4 × 4 probability table. In panel (G), the probability values are low and evenly spread across the table, except for the upper left corner, indicating overlap in the space with no cells (MI = 0.0011 bits). In panel (H), the probability values are higher along the diagonal than in other parts, indicating partial correlation in the placement of red and green cells (MI = 0.0320 bits). In panel (I), there are probability values on the diagonal only and the probabilities off the diagonal are 0 since there is complete correlation in the placement of red and green cells (MI = 0.8610 bits). The calculation of entropy H(r) and H(g), joint entropy H(r, g), and MI are shown for each case.
Figure 3
Figure 3
Validation of MI and NMI. Panel (A) shows 3 samples of simulated 512 × 512 images that consist of 500 green cells and a number of red cells uniformly distributed between 100 and 500. Each pixel intensity of the red and green cells is randomly assigned, and each cell is a square of 11 × 11 pixels. The red cell locations are chosen from a Gaussian distribution centered at the location of green cells with SD (σ) 0 and 5 in the first and second images, and uniformly random in the third image. (B) shows boxplots of MI in bits and (C) shows boxplots of NMI (unitless) of simulated images where the SD (σ) ranges from 0 to 10. 2 additional special cases are shown: 0* and u. 0* indicates that red and green color intensities are identical in corresponding locations which maximizes both MI and NMI. u indicates that the cells are placed uniformly at random within the image and with uniform random color intensity, resulting in the lowest MI and NMI. Increasing σ decreases the spatial association of cells. As spatial association decreases, and both MI and NMI systematically decrease, demonstrating that they are useful metrics that indicate spatial association between cells.
Figure 4
Figure 4
Regionalized PCC and NMI on simulated data. Simulated images are 512 × 512 pixels with 500 red and 500 green 11 × 11 pixel square-shaped cells. The red cell locations are chosen from a Gaussian distribution centered at the location of green cells with SD (σ), which ranges from 0 to 10 and u. u indicates that the cells are placed uniformly at random within the images and with uniform random color intensity. (A) NMI calculated on simulated images with regions of sizes 6 μm × 6 μm (blue), 18 μm × 18 μm (green), 30 μm × 30 μm (red), and single pixels (1.2 μm × 1.2 μm, cyan). (B) PCC of simulated images using the same regions.
Figure 5
Figure 5
(A) Sample images of T:DC (T cells labeled in red and DCs labeled in green), T:FRC (T cells labeled in red and FRCs labeled in green), and T:BV (T cells labeled in green and blood vessel labeled in red). (B,C) Line plots representing the NMI (B) and PCC (C) of T cells and DCs (T:DC, green line), T cells and FRCs (T:FRC, blue dashed line), and T cells and blood vessel (T:BV, black dotted line). NMI and PCC were calculated on pixels (region length = 1.2 μm), or regionalized images of increasing side length (6, 18, and 30 μm). Red stars indicate medians for the corresponding region size, and error bars indicate the 95% confidence interval around the median (40). For NMI, Mann–Whitney p values for T:DC–T:FRC, T:DC–T:BV, and T:FRC-T:BV comparisons < e−4 for all region lengths except T:DC–T:BV (region length = 18 μm) p value = 0.0012. For PCC, Mann–Whitney p values for T:DC–T:FRC, T:DC–T:BV, and T:FRC-T:BV comparisons < e−4 for all region lengths except T:DC–T:BV (region length = 1.2 μm) p value = 0.0293. (D,E) Notched box plots comparing the NMI (D) and PCC (E) of T cells and DCs with T cells and FRCs at physiologically relevant region lengths of (6, 18, and 30 μm) for T:DC associations and 6 μm for T:FRC associations. Note different scales on the y-axis. Both NMI and PCC are greater for the physiologically relevant region sizes for T:FRC than for T:DC (comparing T:DC at 30 μm to T:FRC at 6 μm p = 0.0022; for all other comparisons p < e–4). T:DC images were from 6 image z-stacks consisting of 4,089 frames from 2 mice and 4 lymph nodes. T:FRC images were from 12 image z-stacks consisting of 9,468 frames from 3 mice and 6 lymph nodes. T:BV images were from 4 image z-stacks consisting of 4,361 frames from 2 mice and 3 lymph nodes.
Figure 6
Figure 6
(A) Sample images of WT T:DC and CCR7−/− T:DC. T cells are labeled in red and DCs are labeled in green. In WT T:DC, T cells are wild-type naïve T cells and in CCR7−/− T:DC, T cells are from CCR7-deficient animals. (B,C) Line plots representing the NMI (B) and PCC (C) of WT T cells and DCs (T(WT):DC, green line) and CCR7−/− T cells and DCs (T(CCR7−/−):DC, blue dashed line). NMI and PCC were calculated on pixels (region length = 1.2 μm), or regionalized images of increasing side length (6, 18, and 30 μm). Red stars indicate medians for the corresponding region size, and error bars indicate the 95% confidence interval around the median (40). For NMI, Mann–Whitney p values for T(WT):DC–T(CCR7−/−):DC comparisons < e−4 for all region lengths. For PCC Mann–Whitney p values for T(WT):DC–T(CCR7−/−):DC comparisons for region lengths 1.2, 6, 18, and 30 μm: Region length 1.2 μm p < e−4, 6 μm p = 0.9152, 18 μm p = 0.0021, 30 μm p < e−4. WT T:DC images were from 6 image z-stacks consisting of 4,089 frames using 2 mice and 4 lymph nodes. CCR7−/− data are from 12 image z-stacks consisting of 11,294 frames using 4 mice and 8 lymph nodes.

References

    1. Mirsky HP, Miller MJ, Linderman JJ, Kirschner DE. Systems biology approaches for understanding cellular mechanisms of immunity in lymph nodes during infection. J Theor Biol (2011) 287:160–70.10.1016/j.jtbi.2011.06.037 - DOI - PMC - PubMed
    1. Brewitz A, Eickhoff S, Dähling S, Quast T, Bedoui S, Kroczek RA, et al. CD8+ T cells orchestrate pDC-XCR1+ dendritic cell spatial and functional cooperativity to optimize priming. Immunity (2017) 46(2):205–19.10.1016/j.immuni.2017.01.003 - DOI - PMC - PubMed
    1. Wong HS, Germain RN. Robust control of the adaptive immune system. Semin Immunol (2018) 36:17–27.10.1016/j.smim.2017.12.009 - DOI - PubMed
    1. Baekkevold ES, Yamanaka T, Palframan RT, Carlsen HS, Reinholt FP, von Andrian UH, et al. The CCR7 ligand elc (CCL19) is transcytosed in high endothelial venules and mediates T cell recruitment. J Exp Med (2001) 193(9):1105–12.10.1084/jem.193.9.1105 - DOI - PMC - PubMed
    1. Gretz JE, Norbury CC, Anderson AO, Proudfoot AEI, Shaw S. Lymph-borne chemokines and other low molecular weight molecules reach high endothelial venules via specialized conduits while a functional barrier limits access to the lymphocyte microenvironments in lymph node cortex. J Exp Med (2000) 192(10):1425–40.10.1084/jem.192.10.1425 - DOI - PMC - PubMed

Publication types