. 2018 Jul 26:9:1683.
doi: 10.3389/fimmu.2018.01683. eCollection 2018.

Interleukin (IL)-2 Is a Key Regulator of T Helper 1 and T Helper 2 Cytokine Expression in Fish: Functional Characterization of Two Divergent IL2 Paralogs in Salmonids

Affiliations

Interleukin (IL)-2 Is a Key Regulator of T Helper 1 and T Helper 2 Cytokine Expression in Fish: Functional Characterization of Two Divergent IL2 Paralogs in Salmonids

Tiehui Wang et al. Front Immunol. .

Abstract

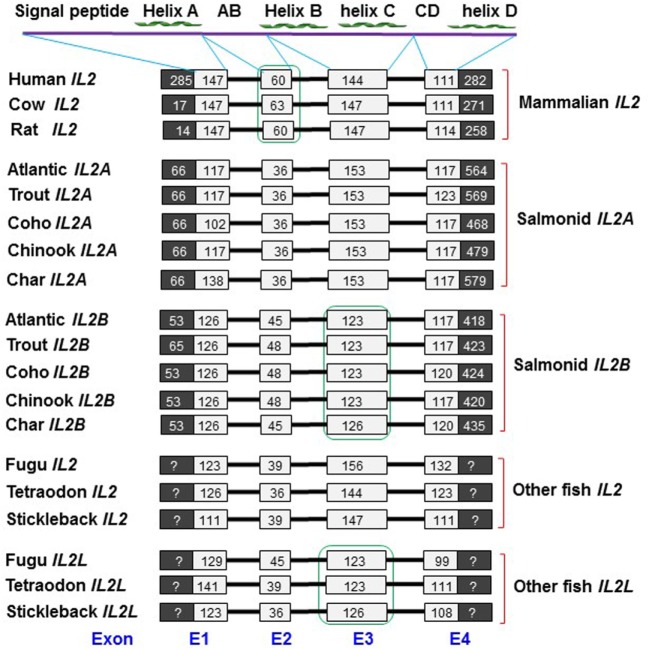
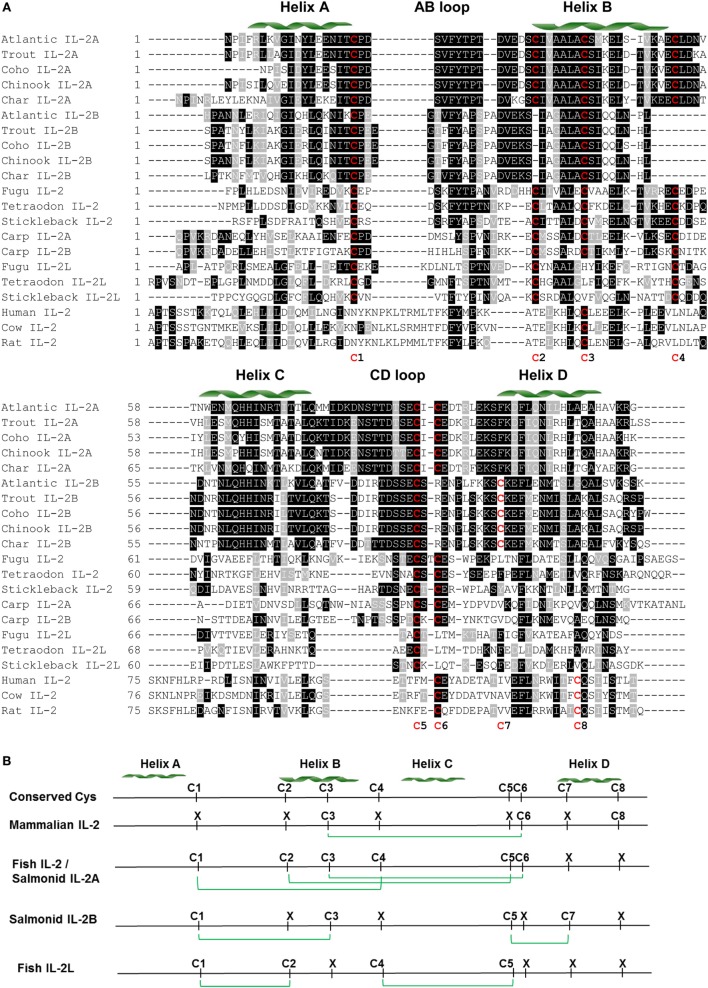
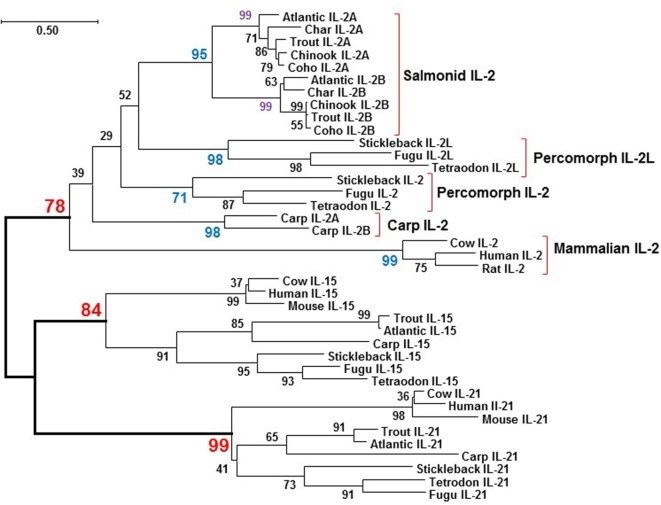
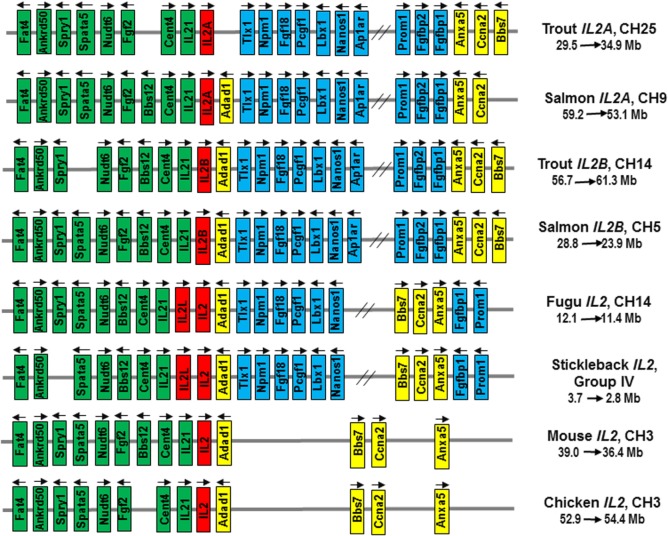
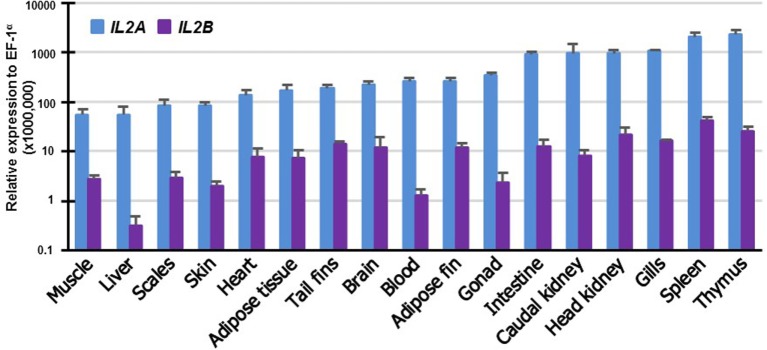
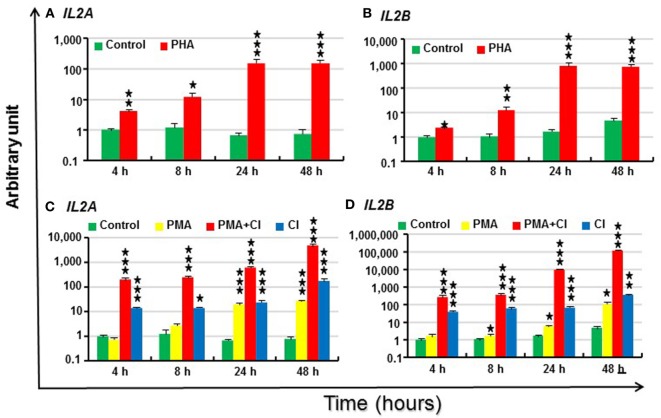
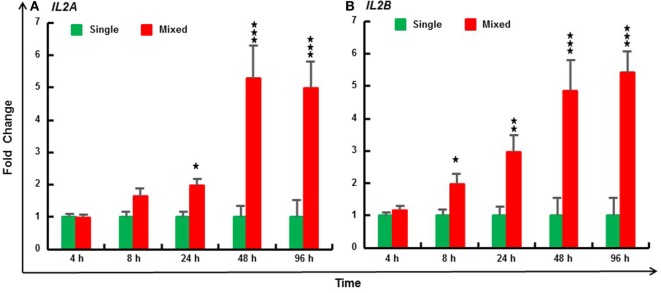
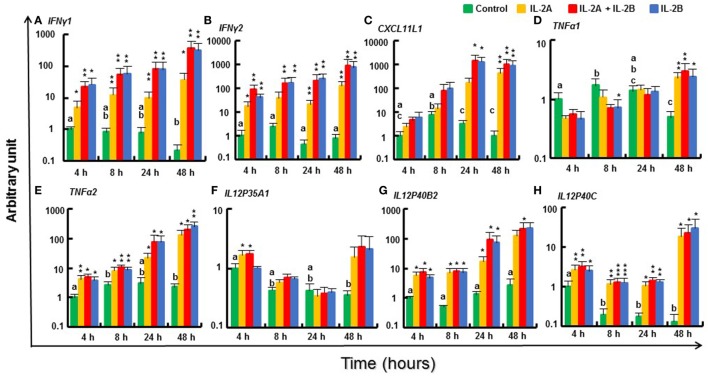
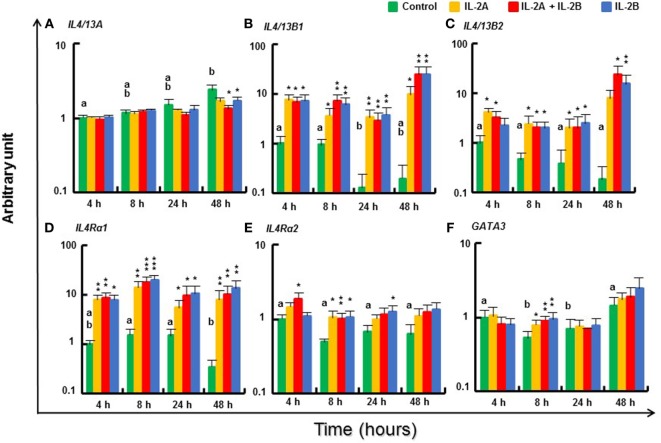
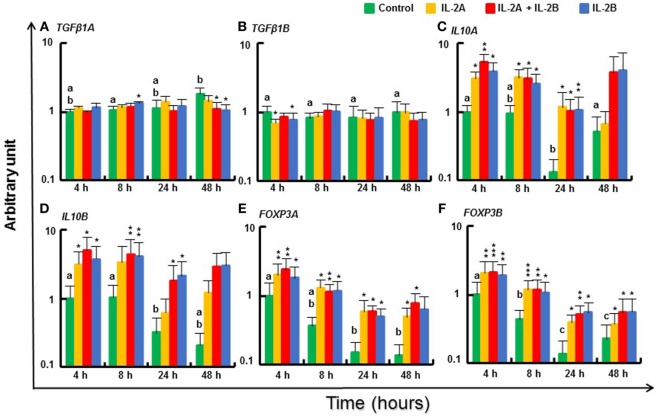
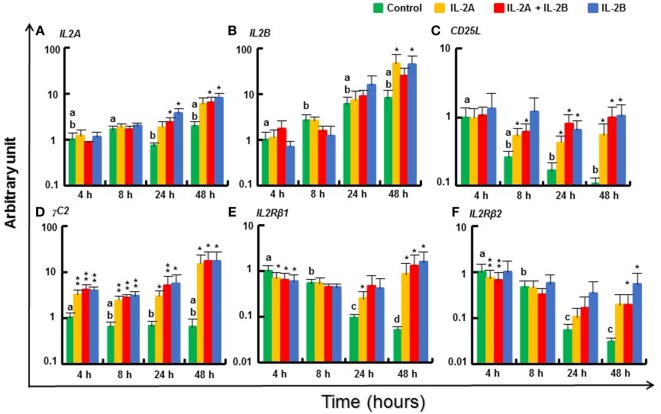
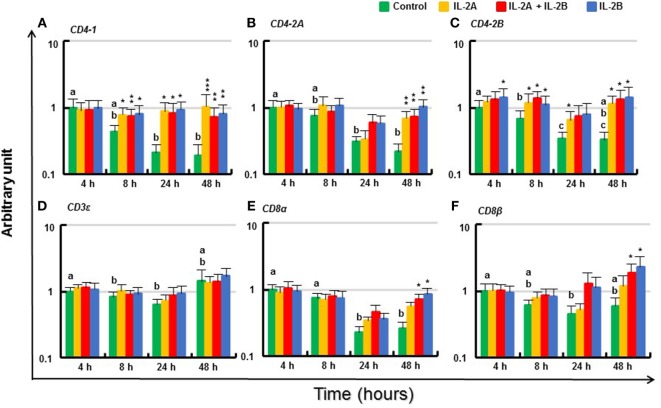
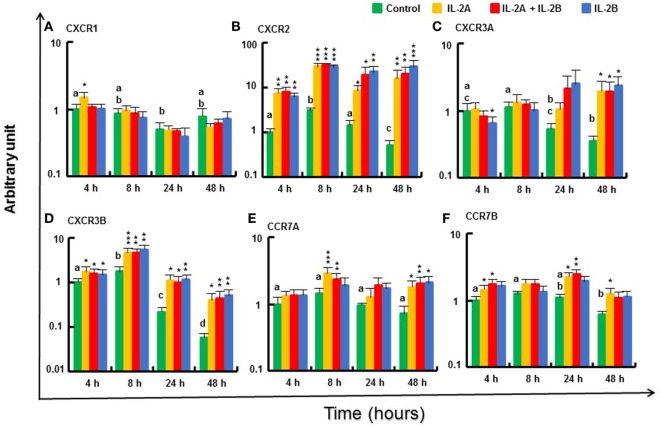
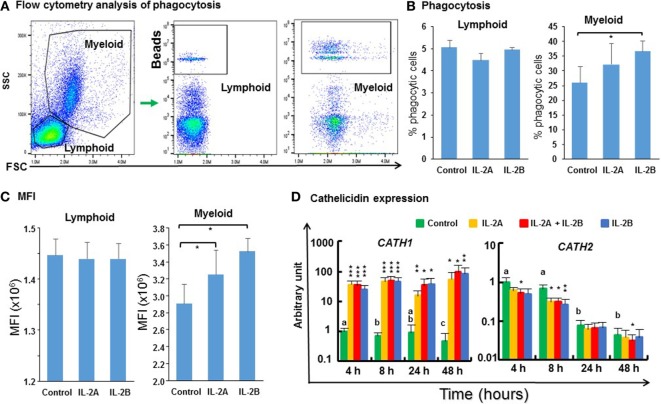
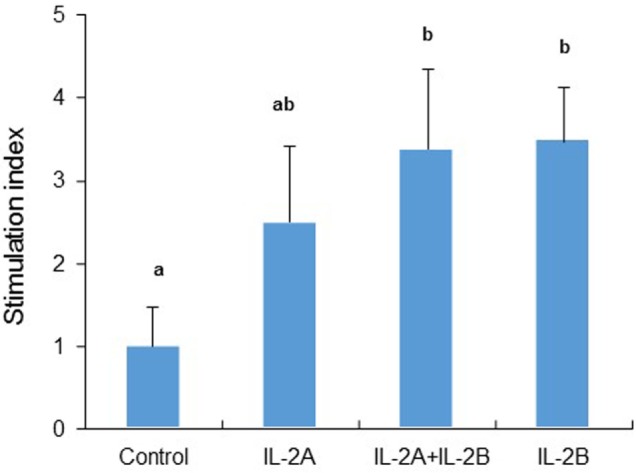
Mammalian interleukin (IL)-2 is a cytokine centrally involved in the differentiation and survival of CD4+ T helper subsets and CD4+ T regulatory cells and in activation of cytotoxic effector lymphocytes. In bony fish, IL2 orthologs have been identified with an additional divergent IL2-Like gene on the same locus present in several fish species. We report here two divergent IL2 paralogs, IL2A and IL2B, in salmonids that originated from the whole genome duplication event in this fish lineage. The salmonid IL2 paralogs differ not only in sequence but also in exon sizes. The IL-2 isoforms that are encoded have disparate pI values and may have evolved to preferentially bind specific IL-2 receptors. Rainbow trout IL2 paralogs are highly expressed in thymus, spleen, gills, kidney and intestine, important tissues/organs in fish T cell development and function. Their expression in peripheral blood leukocytes (PBL) is low constitutively but can be upregulated by the mixed leukocyte reaction, by the T cell mitogen phytohemagglutinin and by signal mimics of T cell activation (phorbol 12-myristate 13-acetate and calcium ionophore). Both trout IL-2 isoforms promoted PBL proliferation and sustained high-level expression of CD4 and CD8, suggesting that trout IL-2 isoforms are T cell growth/survival factors mainly expressed by activated T cells. The recombinant proteins for these two trout IL2 paralogs have been produced in E. coli and possess shared but also distinct bioactivities. IL-2A, but not IL-2B, induced IL12P35A1 and CXCR1 expression in PBL. IL-2B had a stronger effect on upregulation of the T helper 1 (Th1) cytokine interferon-γ (IFNγ) and could sustain CD8α and CD8β expression levels. Nevertheless, both cytokines upregulated key Th1 (IFNγ1, IFNγ2, TNFα2 and IL12) and T helper 2 (Th2) cytokines (IL4/13B1 and IL4/13B2), cytokine and chemokine receptors and the antimicrobial peptide cathelicidin-1 but had limited effects on T helper 17 cytokines and TGFβ1 in PBL. They could also enhance PBL phagocytosis. These results suggest, for the first time in fish, that IL-2 isoforms may have an important role in regulating Th1 and Th2 cell development, and innate and adaptive host defenses in fish, and shed light on lineage-specific expansion, evolution, and functional diversification of IL2 in vertebrates.

Keywords: T cell growth factor; T helper 1; T helper 2; bioactivity; expression; interleukin-2; phagocytosis; salmonids.


Figures

Figure 1
Figure 1
Comparison of the gene organization of salmonid IL2 genes with mammalian IL2 and other fish IL2 and IL2L genes. The black and white boxes represent non-coding and amino acid (aa) coding regions, respectively. The black bars represent introns. The sizes (bp) of the coding regions are numbered in the boxes. The gene organization of the salmonid IL2 genes was predicted using the Spidey program based on the sequence information from Table S2 and Figures S1–S9 in Supplementary Material. The human, cow, and rat IL2 gene organization was extracted from Ensemble genes ENSG00000109471, ENSBTAG00000020883, and ENSRNOG00000017348, respectively. Other fish IL2/IL2L genes were extracted from the NCBI genomic sequences NC_018903 (Fugu), CAAE01023259 (Tetraodon), and AANH01006550 (Stickleback). The aa sequence domains (signal peptide, helices A–D, AB, and CD loops) encoded by each exon are indicated above.
Figure 2
Figure 2
Amino acid (aa) sequence alignment of IL-2 mature peptides from salmonids and selected fish and mammalian species (A) and predicted potential intra-molecular disulfide bonds (B). (A) The multiple alignment was produced using ClustalW, and conserved aa shaded using BOXSHADE (version 3.21). The four α helices (A–D) are indicated above the alignment. The conserved cysteine residues are in red and numbered at the bottom of the alignment (C1–8). The aa sequences and accession numbers are detailed in Supplementary Material: protein sequences. (B) Lineage- and paralog-specific conservation of cysteine residues in mammalian IL-2, salmonid IL-2A and other fish IL-2, and salmonid IL-2B and IL-2L is apparent. Cysteine residues potentially forming disulfide bonds are linked by green lines.
Figure 3
Figure 3
Phylogenetic tree analysis of salmonid IL-2, IL-2 and IL-2L from other fish species, and selected mammalian IL-2 molecules with the closely related γC cytokines IL-15 and IL-21. The phylogenetic tree was constructed using amino acid (aa) multiple alignments and the neighbor-joining method within the MEGA7.0 program (36). The percentage of replicate trees in which the associated taxa clustered together in the bootstrap test (10,000 replicates) is shown next to the branches. The evolutionary distances were computed using the JTT matrix-based method with all ambiguous positions removed for each sequence pair. The aa sequences and accession numbers are detailed in Supplementary Material: protein sequence.
Figure 4
Figure 4
Gene synteny at the IL2 loci in salmonids in comparison to other teleosts (Fugu, stickleback), mammals (mouse), and birds (chicken). The mouse and chicken IL2 loci were analyzed using the Genomicus program (database version: 90.01). The information for salmonid and fugu IL2 loci was extracted from NCBI reference genome sequences NC_035101 (Trout IL2A), NC_035090 (Trout IL2B), NC_027308 (Atlantic salmon IL2A), NC_027304 (Atlantic salmon IL2B), and NC_018903 (Fugu, Takifugu rubripes). The stickleback Gasterosteus aculeatus IL2 loci was extracted from Ensembl database (https://www.ensembl.org/Gasterosteus_aculeatus/Location/View?r=groupIV:2800000-3700000). Arrows indicate transcriptional direction. IL2 genes are in red. The genes syntenically conserved across vertebrates are in green (upstream of IL2) or yellow (downstream of IL2), and those conserved in teleosts only are in blue.
Figure 5
Figure 5
Tissue distribution of transcript expression of IL2 paralogs in rainbow trout. The expression level of the two trout IL2 paralogs was determined by real-time RT-PCR in 17 tissues from six fish. The transcript level was calculated using a serial dilution of references that contained equal molar amounts of the probes for each gene and was normalized against the expression level of EF1α. The results represent the average + SEM of six fish.
Figure 6
Figure 6
Modulation of IL2 paralog expression in rainbow trout peripheral blood leukocytes (PBL) by phytohemagglutinin (PHA) (A,B), phorbol 12-myristate 13-acetate (PMA) and calcium ionophore (CI) (C,D). PBL freshly prepared from four fish were individually stimulated with PHA (10 µg/ml), PMA (50 ng/ml), CI A23187 (100 ng/ml), or a combination of PMA and CI for 4, 8, 24 and 48 h. The expression of IL2 paralogs was measured by RT-qPCR. The mean (+SEM) relative expression is presented as arbitrary units where one unit equals the average expression level in control PBL at 4 h. The outcome of a paired samples T-test between stimulated samples and controls at the same time point is shown above the bars as *p ≤ 0.05, **p ≤ 0.01, and ***p ≤ 0.001. The expression levels in PMA + CI stimulated samples are significantly higher than either samples stimulated with PMA or CI alone at all the time points (p ≤ 0.05).
Figure 7
Figure 7
Mixed leukocyte reaction induced expression of IL2A (A) and IL2B (B) in rainbow trout peripheral blood leukocytes (PBL). PBL were prepared from 6 fish (1–6) and incubated at 20°C individually (single) or as a mix of three fish (mixed, 123, 234, 345, 456, 561, and 612) for 4, 8, 24, 48, and 96 h. The expression of IL2 paralogs was measured by RT-qPCR. The data are presented as a mean (+SEM) fold change calculated by the average expression level of mixed PBL divided by that of single fish PBL at the same time point. The relative significance of a LSD post hoc test after a significant one-way analysis of variance between the mixed and single PBL at the same time point is shown above the bars as *p ≤ 0.05, **p ≤ 0.01, and ***p ≤ 0.001.
Figure 8
Figure 8
Modulation of T helper 1 pathway gene expression by IL-2 isoforms in peripheral blood leukocytes (PBL). Freshly prepared PBL from four fish were incubated with 200 ng/ml IL-2A, IL-2B, or both (IL-2A + IL-2B), or with medium alone as control for 4, 8, 24, and 48 h. The expression of IFNγ1 (A), IFNγ2 (B), CXCL11L1 (C), TNFα1 (D), TNFα2 (E), IL12P35A1 (F), IL12P40B2 (G) and IL12P40C (H) was quantified as in Figure 6. The data are presented as mean (+SEM) arbitrary units where one unit equals the average expression level in the control samples at 4 h. Significant results of a paired samples T-test between the stimulated samples and time-matched controls are shown above the bars as *p ≤ 0.05, **p ≤ 0.01, and ***p ≤ 0.001. Different letters over the control bars indicate significant differences over time in the unstimulated cells (p ≤ 0.05). The expression levels in samples treated with IL-2B or IL-2A + IL-2B show no differences but are higher than IL-2A-treated samples for IFNγ1 at 8, 24, and 48 h, IFNγ2 at 8 and 48 h, and CXCL11L1 at 24 h (p ≤ 0.05).
Figure 9
Figure 9
Modulation of T helper 2 pathway gene expression by IL-2 isoforms in peripheral blood leukocytes (PBL). Freshly prepared PBL from four fish were stimulated with IL-2A, IL-2B, IL-2A + IL-2B, or with medium alone as control. The expression of IL4/13A (A), IL4/13B1 (B), IL4/13B2 (C), IL4Rα1 (D), IL4Rα2 (E) and GATA3 (F) was quantified and presented as in Figure 8. Significant results of a paired samples T-test between the stimulated samples and time-matched controls are shown above the bars as *p ≤ 0.05, **p ≤ 0.01, and ***p ≤ 0.001. Different letters over the control bars indicate significant differences over time in the unstimulated cells (p ≤ 0.05). The expression levels in samples treated with IL-2A + IL-2B are higher than with IL-2A for IL-4/13B1 and IL4Rα1 at 8 h, IL-4/13B2 at 48 h, and higher than either IL-2A or IL-2B alone for IL4Rα2 at 4 h (p ≤ 0.05).
Figure 10
Figure 10
Modulation of regulatory pathway gene expression by IL-2 isoforms in peripheral blood leukocytes (PBL). Freshly prepared PBL from four fish were stimulated with IL-2A, IL-2B, IL-2A + IL-2B, or with medium alone as control. The expression of TGFβ1A (A), TGFβ1B (B), IL10A (C), IL10B (D), FOXP3A (E) and FOXP3B (F) was quantified and presented as in Figure 8. Significant results of a paired samples T-test between the stimulated samples and time-matched controls are shown above the bars as *p ≤ 0.05, **p ≤ 0.01, and ***p ≤ 0.001. Different letters over the control bars indicate significant differences over time in the unstimulated cells (p ≤ 0.05). The expression levels in samples treated with IL-2A + IL-2B are higher than with IL-2A for IL10A and FOXP3A at 4 h, and IL10B at 24 h, and higher than with IL-2B for IL10B at 4 h (p ≤ 0.05).
Figure 11
Figure 11
Modulation of IL2 and IL2R gene expression by IL-2 isoforms in peripheral blood leukocytes (PBL). Freshly prepared PBL from four fish were stimulated with IL-2A, IL-2B, IL-2A + IL-2B, or with medium alone as control. The expression of IL2A (A), IL2B (B), CD25L (C), γC2 (D), IL2Rβ1 (E) and IL2Rβ2 (F) was quantified and presented as in Figure 8. Significant results of a paired samples T-test between the stimulated samples and time-matched controls are shown above the bars as *p ≤ 0.05, **p ≤ 0.01, and ***p ≤ 0.001. Different letters over the control bars indicate significant differences over time in the unstimulated cells (p ≤ 0.05). The expression levels in samples treated with IL-2B are higher than with IL-2A for IL2A at 24 h, and IL2Rβ2 at 48 h, but lower than with IL-2A for IL2Rβ1 at 4 h (p ≤ 0.05).
Figure 12
Figure 12
Modulation of T cell marker gene expression by IL-2 isoforms in peripheral blood leukocytes (PBL). Freshly prepared PBL from four fish were stimulated with IL-2A, IL-2B, IL-2A + IL-2B, or with medium alone as control. The expression of CD4-1 (A), CD4-2A (B), CD4-2B (C), CD3ε (D), CD8α (E) and CD8β (F) was quantified and presented as in Figure 8. Significant results of a paired samples T-test between the stimulated samples and time-matched controls are shown above the bars as *p ≤ 0.05, **p ≤ 0.01, and ***p ≤ 0.001. Different letters over the control bars indicate significant differences over time in the unstimulated cells (p ≤ 0.05). The expression levels in samples treated with IL-2B or IL-2A + IL-2B are higher than IL-2A-treated samples for CD8α and CD8β at 48 h (p ≤ 0.05).
Figure 13
Figure 13
Modulation of chemokine receptor gene expression by IL-2 isoforms in peripheral blood leukocytes (PBL). Freshly prepared PBL from four fish were stimulated with IL-2A, IL-2B, IL-2A + IL-2B, or with medium alone as control. The expression of CXCR1 (A), CXCR2 (B), CXCR3A (C), CXCR3B (D), CCR7A (E) and CCR7B (F) was quantified and presented as in Figure 8. Significant results of a paired samples T-test between the stimulated samples and time-matched controls are shown above the bars as *p ≤ 0.05, **p ≤ 0.01, and ***p ≤ 0.001. Different letters over the control bars indicate significant differences over time in the unstimulated cells (p ≤ 0.05). The expression levels in samples treated with IL-2A are higher than with IL-2B for CXCR1 and CXCR3A at 4 h and CCR7A at 8 h, but lower for CXCR2 than with IL-2B or IL-2A + IL-2B at 24 h, and IL-2B at 48 h (p ≤ 0.05).
Figure 14
Figure 14
Flow cytometry analysis of phagocytosis (A), percentage of phagocytic cells (B), mean fluorescence intensity (MFI) of phagocytic cells (C), and cathelicidin gene expression modulated by IL-2 isoforms in peripheral blood leukocytes (PBL) (D). (A) Trout PBL were incubated with IL-2A, IL-2B, or medium alone as control for 24 h. PBL were then incubated with 1.0-µm fluorescent beads for 3 h and analyzed by flow cytometry. Typical results from a single fish are shown. (B) The percentage of phagocytic leukocytes in lymphoid and myeloid gates. The results are presented as the average + SEM of three fish. “*” indicates significant differences (p ≤ 0.5) of a paired samples T-test. (C) The MFI of phagocytic lymphoid and myeloid cells. The results are presented as the average + SEM of three fish. “*” indicates significant differences (p ≤ 0.5) of a paired samples T-test. (D) Freshly prepared PBL were stimulated with IL-2A, IL-2B, IL-2A + IL-2B, or with medium alone as control for 4, 8, 24 and 48 h, and the expression of CATH1 and CATH2 quantified. The results are presented as the average + SEM from four fish. Significant results of a paired samples T-test between the stimulated samples and time-matched controls are shown above the bars as: *p ≤ 0.05, **p ≤ 0.01, and ***p ≤ 0.001. Different letters over the control bars indicate significant differences over time in the unstimulated cells (p ≤ 0.05).
Figure 15
Figure 15
Rainbow trout IL-2 isoforms promote proliferation in peripheral blood leukocytes (PBL). Freshly prepared PBL from four fish were incubated with IL-2A and IL-2B, or with medium alone as control in triplicate for 3 days. BrdU was added 20 h before incorporation of BrdU was detected by ELISA. The data are presented as the average (+SEM) stimulation index, calculated as the OD450 of IL-2-treated cells divided by that of untreated samples. Different letters over bars indicate significant differences (p ≤ 0.05, paired samples T-test).

References

    1. Morgan DA, Ruscetti FW, Gallo R. Selective in vitro growth of T lymphocytes from normal human bone marrows. Science (1976) 193:1007–8.10.1126/science.181845 - DOI - PubMed
    1. Taniguchi T, Matsui H, Fujita T, Takaoka C, Kashima N, Yoshimoto R, et al. Structure and expression of a cloned cDNA for human interleukin-2. Nature (1983) 302:305–10.10.1038/302305a0 - DOI - PubMed
    1. Arenas-Ramirez N, Woytschak J, Boyman O. Interleukin-2: biology, design and application. Trends Immunol (2015) 36:763–77.10.1016/j.it.2015.10.003 - DOI - PubMed
    1. Mitra S, Leonard WJ. Biology of IL-2 and its therapeutic modulation: mechanisms and strategies. J Leukoc Biol (2018) 103(4):643–55.10.1002/JLB.2RI0717-278R - DOI - PubMed
    1. Wang T, Secombes CJ. The cytokine networks of adaptive immunity in fish. Fish Shellfish Immunol (2013) 35:1703–18.10.1016/j.fsi.2013.08.030 - DOI - PubMed

Publication types

MeSH terms