. 2018 Sep;27(9):1680-1691.
doi: 10.1002/pro.3447. Epub 2018 Aug 10.

Characterization of the two conformations adopted by the T3SS inner-membrane protein PrgK

Affiliations

Characterization of the two conformations adopted by the T3SS inner-membrane protein PrgK

Julien R C Bergeron et al. Protein Sci. 2018 Sep.

Abstract

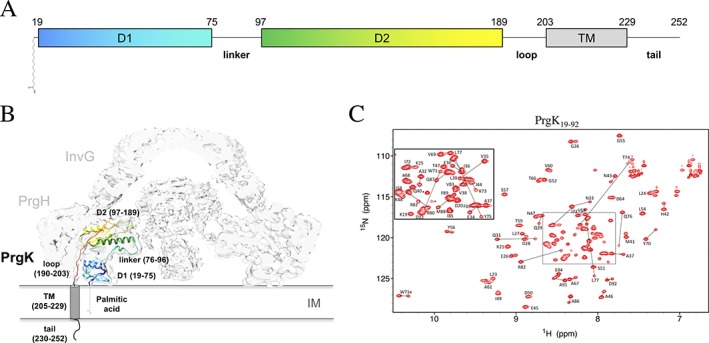
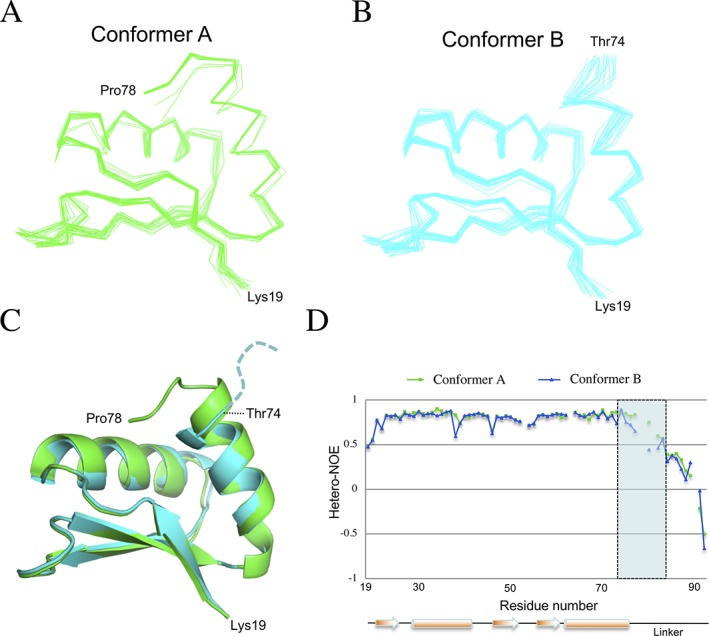
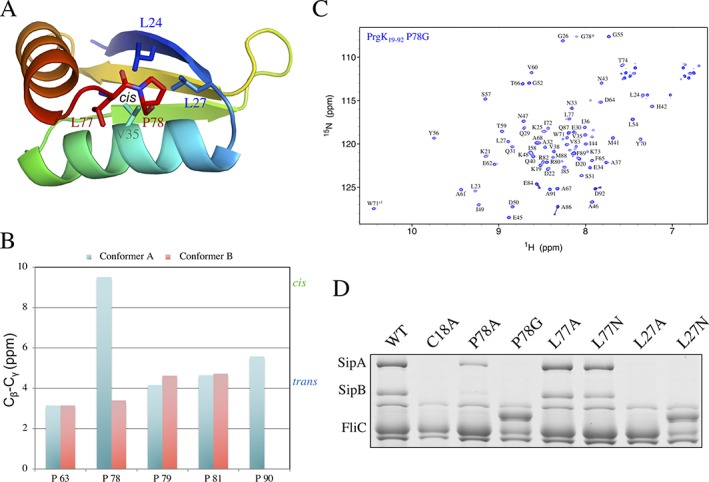
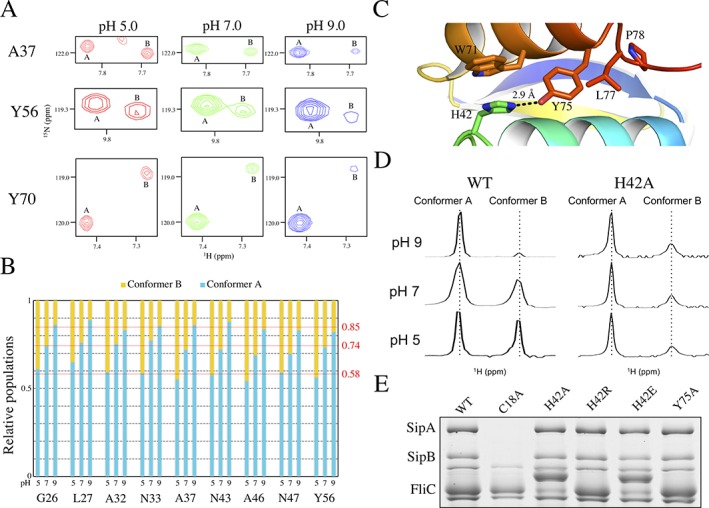
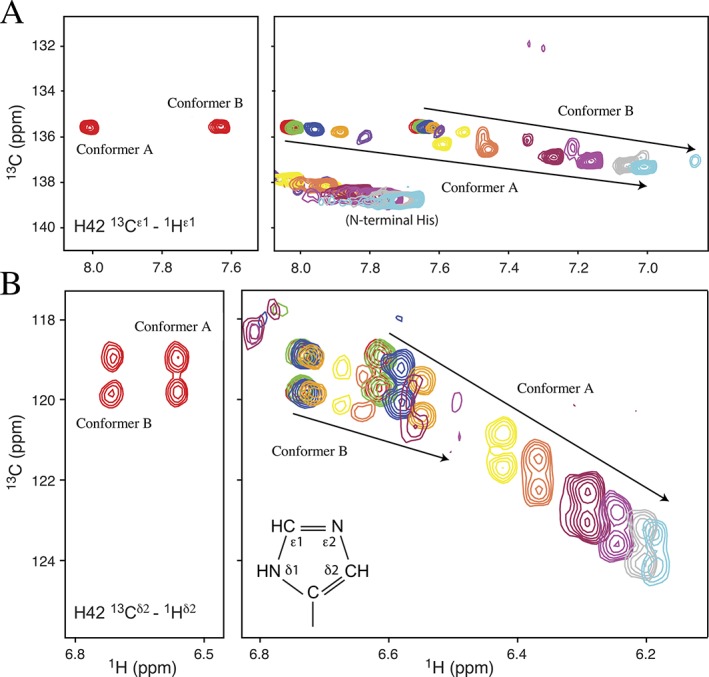
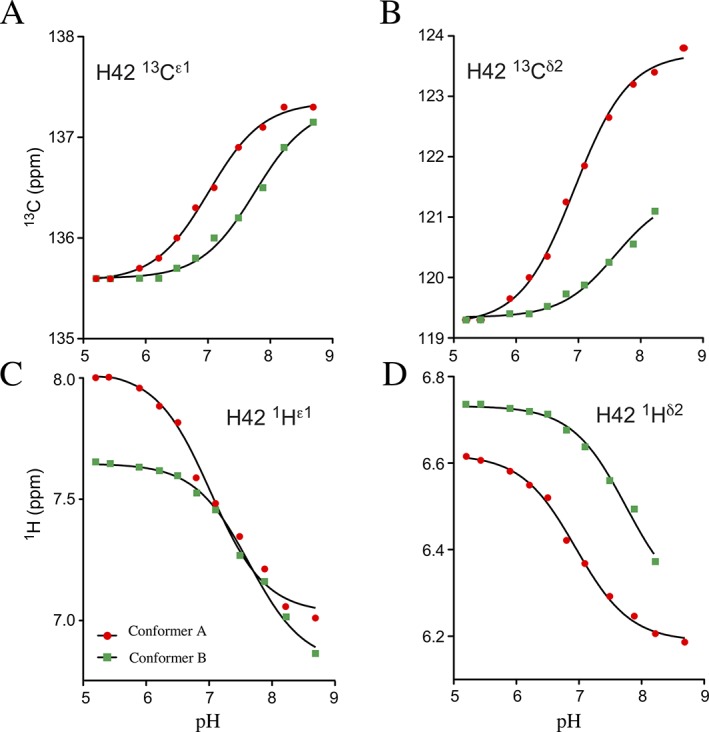
The pathogenic bacterium Salmonella enterica serovar Typhimurium utilizes two type III secretion systems (T3SS) to inject effector proteins into target cells upon infection. The T3SS secretion apparatus (the injectisome) is a large macromolecular assembly composed of over twenty proteins, many in highly oligomeric states. A sub-structure of the injectisome, termed the basal body, spans both membranes and the periplasmic space of the bacterium. It is primarily composed of three integral membranes proteins, InvG, PrgH, and PrgK, that form ring structures through which components are secreted. In particular, PrgK possesses a periplasmic region consisting of two globular domains joined by a linker polypeptide. We showed previously that in isolation, this region adopts two distinct conformations, of with only one is observed in the assembled basal body complex. Here, using NMR spectroscopy, we further characterize these two conformations. In particular, we demonstrate that the interaction of the linker region with the first globular domain, as found in the intact basal body, is dependent upon the cis conformation of the Leu77-Pro78 peptide. Furthermore, this interaction is pH-dependent due to coupling with hydrogen bond formation between Tyr75 and His42 in its neutral Nδ1 H tautomeric form. This pH-dependent interaction may play a role in the regulation of the secretion apparatus disassembly in the context of bacterial infection.

Keywords: NMR; Salmonella enterica serovar Typhimurium; bacterial secretion systems; protein dynamics.


Figures

Figure 1
Figure 1
Structure and conformations of the PrgK periplasmic domain. (A) Schematic representation of PrgK, with the boundaries of the D1, linker, D2, loop and TM indicated, along with an N‐terminal cysteine‐linked palmitic acid. (B) Cartoon representation of the PrgK structure (colored; PDB ID 5TCP) in the cryo‐EM map of the basal body complex17 (EMDB ID 8398). (C) Assigned 15N‐HSQC spectrum of the PrgK19–92 construct, reproduced from reference 12. The lines connect the two 1HN15N peaks yielded by the residues that differ in the two conformers of this construct
Figure 2
Figure 2
Structural ensembles of the two PrgK19–92 conformers. Line representation of the backbone atoms for the twenty lowest‐energy models for PrgK19–92 in the (A) conformer A and (B) conformer B, obtained with CS‐Rosetta.20 (C) The two averaged structures are overlaid in cartoon representation, with conformer A in green and conformer B in cyan. The only significant difference lies at their C‐termini, where residues 75–78 of the linker are ordered in conformer A but not in conformer B. (D) The heteronuclear NOE values for the two populations of PrgK19–92 plotted versus sequence, with the secondary structure shown at the bottom. Decreasing NOE values indicate increasing mobility of the 1HN15N bond on the sub‐nsec timescale. This confirms that residues 75–78 (shaded rectangle) are ordered in conformer A, but flexible in conformer B
Figure 3
Figure 3
The two conformers correspond to the cis or trans isomers of the Leu77‐Pro78 peptide. (A) Cartoon representation of the ordered residues (19–78) from the lowest‐energy model for the conformer A structure, in rainbow coloring. The residues involved in the linker‐D1 interaction are in stick representation. (B) Difference between the chemical shifts of the 13Cβ and 13Cγ nuclei of each proline residue in the two PrgK19–92 conformers. For most prolines, the difference is ∼4.2 ppm (blue dashed line), corresponding to the average value for a trans X‐Pro isomer.25 In contrast, for Pro78 in conformer A, the difference is 9.6 ppm, corresponding to that of a cis X‐Pro isomer (green dashed line). (C) 15N‐HSQC spectrum of PrgK19–92 with the P78G mutation. The peak for G78, that was introduced instead of a proline in this mutant, is indicated with an asterisk. For most residues, a single 1HN15N peak is visible, confirming that this mutation abrogates the linker‐D1 interaction and leads to only conformer B. Residues Glu84, Ala86 and Asp92 still yield two peaks, possibly corresponding to the trans (major) and cis (minor) isomers of Met89‐Pro90. (D) Secretion assay for mutants of Leu27, Leu77 and Pro78. SipA and SipB are effector proteins, secreted when a functional T3SS is formed. FliC is used as a loading control. Mutation of Pro78 and Leu27 abrogates secretion, unlike mutation of Leu77, which has no phenotype. For some mutants (P78G and L27N), FliC runs slower on the gel, likely due to variable glycosylation9, 12
Figure 4
Figure 4
The PrgK population ratio is affected by pH. (A) Selected regions from the overlaid 15N‐HSQC spectra of PrgK19–92 at pH 5 (red), pH 7 (green) and pH 9 (blue). With increasing pH, the corresponding signals from conformer B become weaker relative to those from conformer A. (B) The relative populations of the A and B conformers, IA/(IA + IB) and IB/(IA + IB), determined from corresponding 15N‐HSQC peak intensity ratios, are plotted for selected residues as a function of sample pH value. The relative population of conformer A increases from ∼0.58 at pH 5 to 0.74 at pH 7 and 0.85 at pH 9. Thus, PrgK19–92 preferentially adopts conformer A under more alkaline conditions. Note that peak intensities are also dependent upon amide hydrogen exchange and the relaxation behavior of the 1HH and 15N nuclei, which may differ between conformers A and B. Hence, these intensity ratios are only an approximation of population ratios. (C) Cartoon representation of the PrgK D1 structure in conformer A (PDB ID 4W4M), centered around the salt bridge formed by residues His42 and Tyr75. (D) Expanded, aligned regions of the 1D 1H‐NMR spectra corresponding to the resolved downfield indole 1Hɛ1 signal (∼ 10.5 ppm) of Trp71, for PrgK19–92 WT or with the H42A mutation, at various pH conditions. In the WT protein, two peaks corresponding to the two populations are clearly visible, and their relative intensity varies with sample pH value, as also seen for amides in the spectra of panel A. In contrast, with the H42A mutant, the relative peak intensities are pH‐independent. Although conformer B appears minor in these 1D spectra, in 15N‐HSQC spectra, most amides show approximately equal 1HN15N peak intensities for conformers A and B (Fig. S5). (E) Secretion assay for mutants of His42 and Tyr75, performed as in Figure 3(B). None of the mutations affects secretion in this assay
Figure 5
Figure 5
pH‐dependent chemical shifts of His42. The pK a values of His42 were determined from 15N‐decoupled 13C‐HSQC spectra of PrgK19–92 selectively‐labeled with 13C/15N‐histidine. (Left) Assigned spectra recorded at pH 5.2 showing the (A) 13Cɛ11Hɛ1 and (B) 13Cδ21Hδ2 signals. Each 13Cδ2 signal is a doublet due to scalar coupling with adjacent the 13Cγ. (Right) Eleven superimposed spectra recorded as the sample was titrated in small steps from pH 5.2 (red) to 8.7 (light blue). Signals from conformer B diminish in intensity as conformer A is increasingly favored under alkaline conditions. The nomenclature is illustrated for the neutral Nδ1H tautomer of a histidine sidechain
Figure 6
Figure 6
pK a determination for His42. Averaging the individual fits of the pH‐dependent chemical shifts of four His42 nuclei (from Fig. 5) to the equation for a single acid‐base equilibrium yields apparent pK a values of 7.0 ± 0.1 for conformer A (red circles) and 7.7 ± 0.1 for conformer B (green squares)
Figure 7
Figure 7
Model of the PrgK conformational equilibria. Schematic summary of the conformational equilibria of PrgK involving coupling of linker binding and the ordering of the C‐terminal helix of protein with the cis/trans isomerization of Leu77/Pro78 and the pH‐dependent interaction of Tyr75 with His42. See text for further discussion

References

    1. Costa TR, Felisberto‐Rodrigues C, Meir A, Prevost MS, Redzej A, Trokter M, Waksman G (2015) Secretion systems in Gram‐negative bacteria: structural and mechanistic insights. Nat Rev Microbiol 13:343–359. - PubMed
    1. Buttner D (2012) Protein export according to schedule: architecture, assembly, and regulation of type III secretion systems from plant‐ and animal‐pathogenic bacteria. Microbiol Mol Biol Rev 76:262–310. - PMC - PubMed
    1. Burkinshaw BJ, Strynadka NC (2014) Assembly and structure of the T3SS. Biochim Biophys Acta 1843:1649–1663. - PubMed
    1. Galan JE, Lara‐Tejero M, Marlovits TC, Wagner S (2014) Bacterial type III secretion systems: specialized nanomachines for protein delivery into target cells. Ann Rev Microbiol 68:415–438. - PMC - PubMed
    1. Moest TP, Meresse S (2013) Salmonella T3SSs: successful mission of the secret(ion) agents. Curr Opin Microbiol 16:38–44. - PubMed

Publication types

MeSH terms

Substances

LinkOut - more resources