. 2018 Nov;27(11):957-964.
doi: 10.1097/IJG.0000000000001042.

Fluorescein Aqueous Angiography in Live Normal Human Eyes

Affiliations

Fluorescein Aqueous Angiography in Live Normal Human Eyes

Alex S Huang et al. J Glaucoma. 2018 Nov.

Abstract

Purpose: To evaluate aqueous humor outflow (AHO) in intact eyes of live human subjects during cataract surgery using fluorescein aqueous angiography.

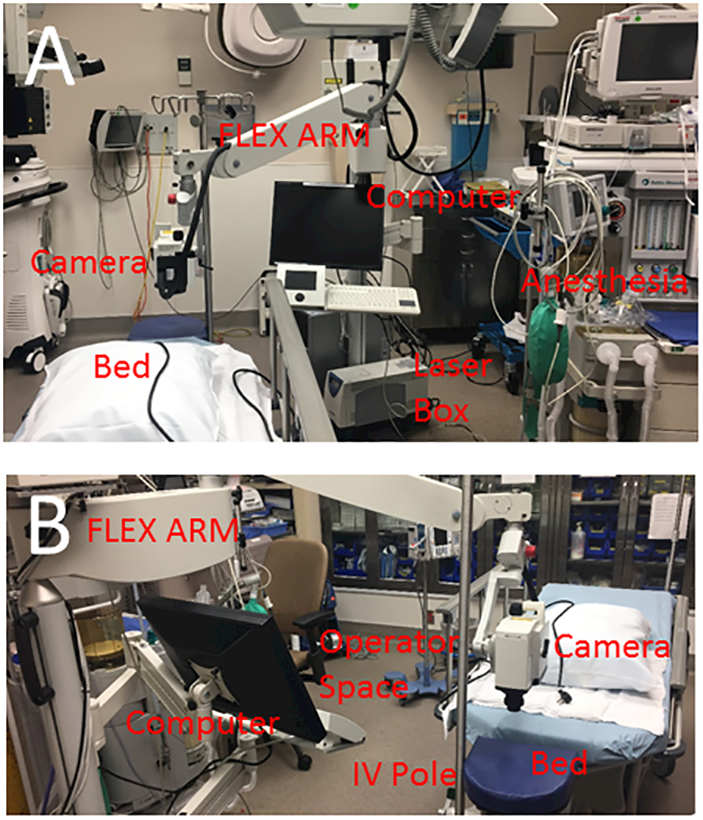
Methods: Aqueous angiography was performed in 8 live human subjects (56 to 86 y old; 2 men and 6 women). After anesthesia, fluorescein (2%) was introduced into the eye [either alone or after indocyanine green (ICG; 0.4%)] from a sterile, gravity-driven constant-pressure reservoir. Aqueous angiographic images were obtained with a Spectralis HRA+OCT and FLEX module (Heidelberg Engineering). Using the same device, anterior-segment optical coherence tomography (OCT) and infrared images were also concurrently taken with aqueous angiography.

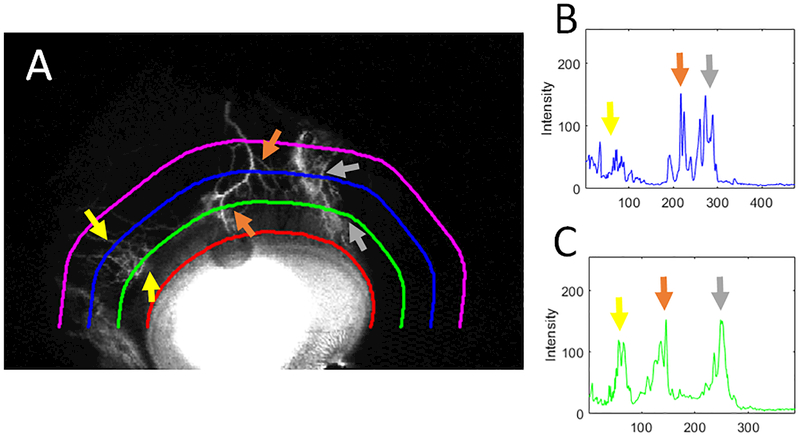
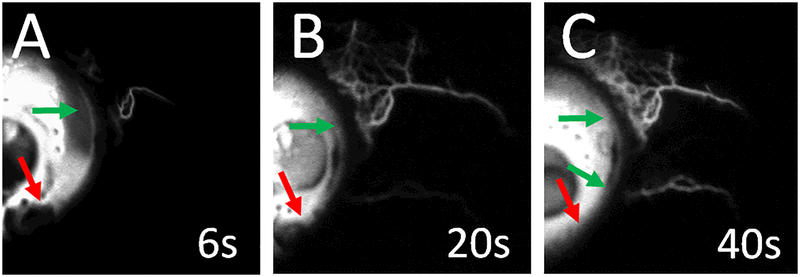
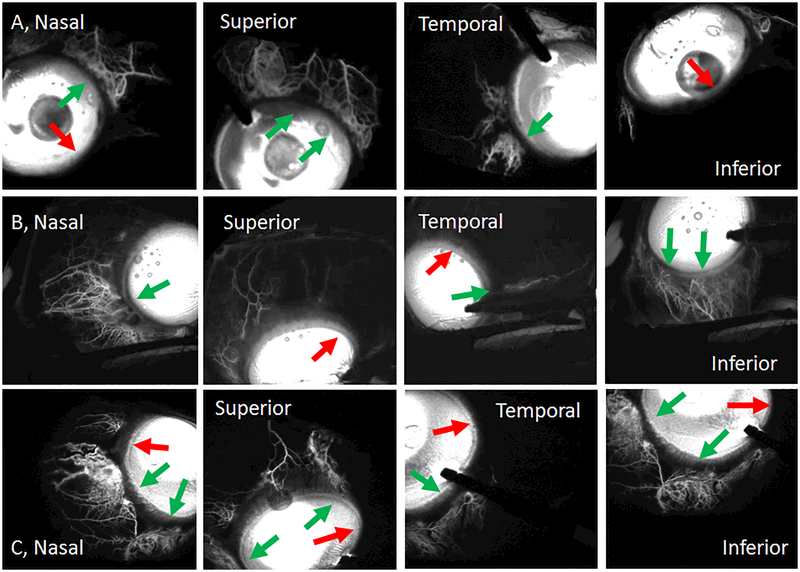
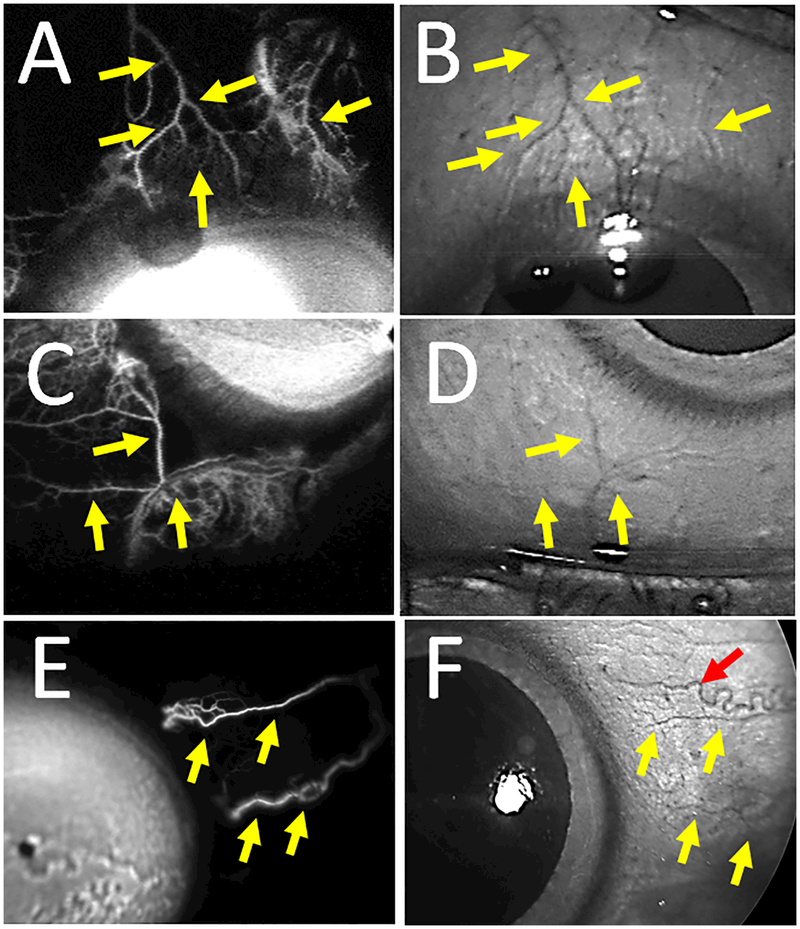
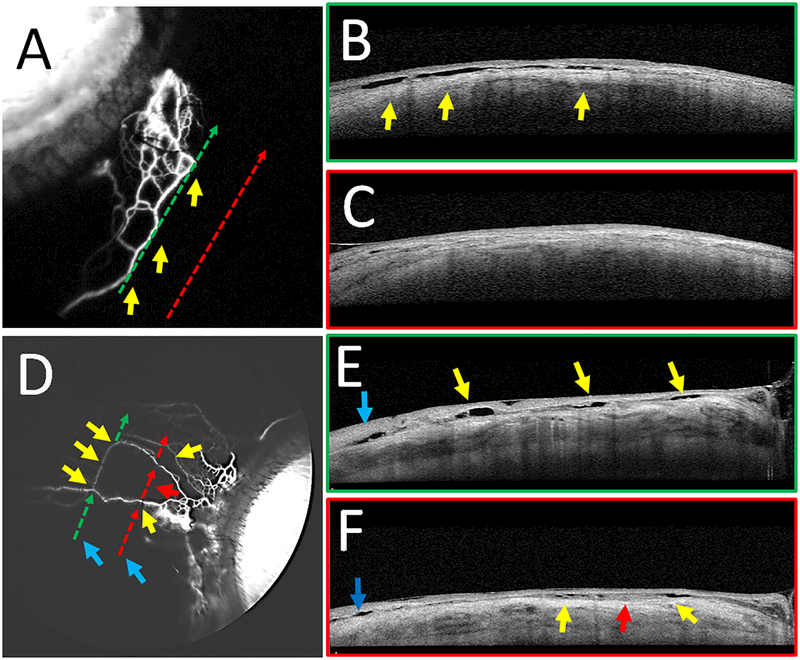
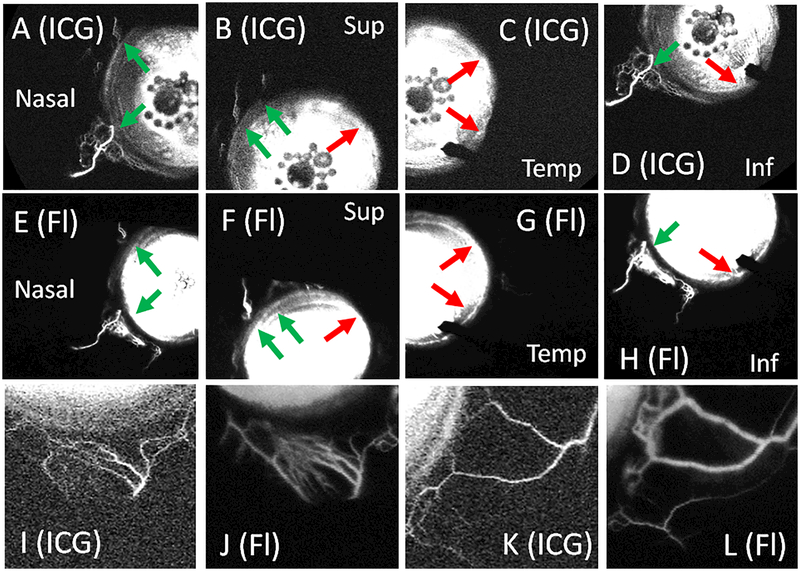
Results: Fluorescein aqueous angiography in the live human eye showed segmental AHO patterns. Initial angiographic signal was seen on average by 14.0±3.0 seconds (mean±SE). Using multimodal imaging, angiographically positive signal colocalized with episcleral veins (infrared imaging) and intrascleral lumens (anterior-segment OCT). Sequential aqueous angiography with ICG followed by fluorescein showed similar segmental angiographic patterns.

Discussion: Fluorescein aqueous angiography in live humans was similar to that reported in nonhuman primates and to ICG aqueous angiography in live humans. As segmental patterns with sequential angiography using ICG followed by fluorescein were similar, these tracers can now be used sequentially, before and after trabecular outflow interventions, to assess their effects on AHO in live human subjects.


Figures

Figure 1.
Figure 1.
Aqueous Angiography Setup in the Operating Room A) The Heidelberg FLEX module is a modified surgical boom integrated with all components of the Spectralis (HRA+OCT) including the computer, laser box, and camera head. The FLEX module is situated near the head of the bed between the bed and anesthesia work space. B) This leaves a space for the FLEX module operator to operate the device next to the patient. An IV pole is placed near the head of the bed for the tracer reservoir.
Figure 2.
Figure 2.
Quantitative Assessment of Angiographic Signal A) For each quadrant (here superior), the limbal border was manually delineated (red line). From this, signal intensity was obtained from three test lines (at 15 [green], 30 [blue], and 45 [purple] pixel-increments from the limbus while maintaining the same shape). B) Plotted over its length, the 30-line (blue) shows distinct peaks. C) Plotted over its length, the 15-line (green) shows even more distinct and larger peaks. Thus, the summative signal intensity was determined for all images using the 15-line and compared between quadrants.
Figure 3.
Figure 3.
Fluorescein Aqueous Angiography Signal Development Subject 1 (right eye; nasal hemisphere) demonstrates increasing fluorescein aqueous angiographic signal (green arrows) over time. Segmental regions of low angiographic signal are also seen (red arrows). White “s” = seconds after tracer introduction.
Figure 4.
Figure 4.
Fluorescein Aqueous Angiography Shows Segmental Outflow Patterns Aqueous angiography in different positions of gaze for subject 1 (Row A; right eye, 24–47 seconds), subject 2 (Row B; left eye, 92–103 seconds) and subject 3 (Row C; left eye, 46–56 seconds). Green arrows identify areas with segmental angiographic signal and red arrows point out segmental regions without angiographic signal. Notice that more overall nasal angiographic signal is seen although some temporal signal is observed. The time ranges represent the time it took to take the first and last image for each patient while looking in different directions. Variation in how much time it took and the time the first image was taken had to do with individual differences in addition to patient compliance (due to dilation and sedation) to take and hold eccentric gazes.
Figure 5.
Figure 5.
Fluorescein Aqueous Angiographic Signal Overlaps Episcleral Veins. A) Aqueous angiographic and (B) CSLO IR images of the superior region of subject 3’s left eye showed overlap between angiographic structures and episcleral veins (yellow arrows). C) Aqueous angiographic and (D) CSLO IR images of the inferior nasal region of subject 3’s left eye showed overlap between angiographic structures and episcleral veins (yellow arrows). E) Aqueous angiographic and (F) CSLO IR images of the nasal region of subject 4’s right eye showed overlap between angiographic structures and episcleral veins (yellow arrows). F) A red arrow points out a corkscrew conjunctival vessel.
Figure 6.
Figure 6.
Fluorescein Aqueous Angiography with Concurrent Anterior Segment OCT Aqueous angiography with anterior segment OCT was performed on subjects 5 (A-C) and 6 (D-F). B/E) OCT (green dotted arrows in A/D) was performed on a regions of high angiographic signal showing intrascleral lumens capable of carrying aqueous humor. Yellows arrows showed correspondence of angiographic signal (A/D) to OCT lumens (B/E). C/F) OCT (red dotted arrows in A/C) was performed on regions without angiographic signal, demonstrating fewer intrascleral lumens (C/F). E/F) Blue arrows on OCT demonstrate lumens not associated with the aqueous angiographic signal that may be related to other luminal structures in the sclera such as arteries or episcleral veins not associated with AHO. In subject 6, given the thinner nature of the angiographic structures, the arrows were broken to avoid covering them.
Figure 7.
Figure 7.
Sequential Aqueous Angiography using ICG Followed by Fluorescein Demonstrates Similar Patterns. Aqueous angiography was performed in subject 7 using ICG (A-D) followed by fluorescein (E-H) in the same left eye. (A-D) ICG aqueous angiography showed segmental regions with (green arrows) and without (red arrows) angiographic signal that were similar to the patterns obtained using fluorescein (E-H). ICG signal started at 9 seconds and fluorescein signal started at 4 seconds. A closer view of subject 8’s inferior (I) and nasal (K) regions using ICG also showed similar patterns to that obtained with fluorescein (J and L). ICG = indocyanine green. Fl = fluorescein. Temp = temporal. Sup = superior. Inf = inferior.

References

    1. Huang AS, Mohindroo C, Weinreb RN. Aqueous Humor Outflow Structure and Function Imaging At the Bench and Bedside: A Review. J Clin Exp Ophthalmol 2016;7(4). - PMC - PubMed
    1. Huang AS, Francis BA, Weinreb RN. Structural and functional imaging of aqueous humour outflow: a review. Clin Exp Ophthalmol 2018;46(2):158–68. - PMC - PubMed
    1. Johnson M ‘What controls aqueous humour outflow resistance?’. Exp Eye Res 2006;82(4):545–57. - PMC - PubMed
    1. Swaminathan SS, Oh DJ, Kang MH, Rhee DJ. Aqueous outflow: segmental and distal flow. J Cataract Refract Surg 2014;40(8):1263–72. - PMC - PubMed
    1. Huang AS, Li M, Yang D, et al. Aqueous Angiography in Living Nonhuman Primates Shows Segmental, Pulsatile, and Dynamic Angiographic Aqueous Humor Outflow. Ophthalmology 2017. - PMC - PubMed

Publication types