. 2018 Aug 10;13(8):e0202168.
doi: 10.1371/journal.pone.0202168. eCollection 2018.

Characterization of the glycerol-3-phosphate acyltransferase gene and its real-time expression under cold stress in Paeonia lactiflora Pall

Affiliations

Characterization of the glycerol-3-phosphate acyltransferase gene and its real-time expression under cold stress in Paeonia lactiflora Pall

Xueting Li et al. PLoS One. .

Abstract

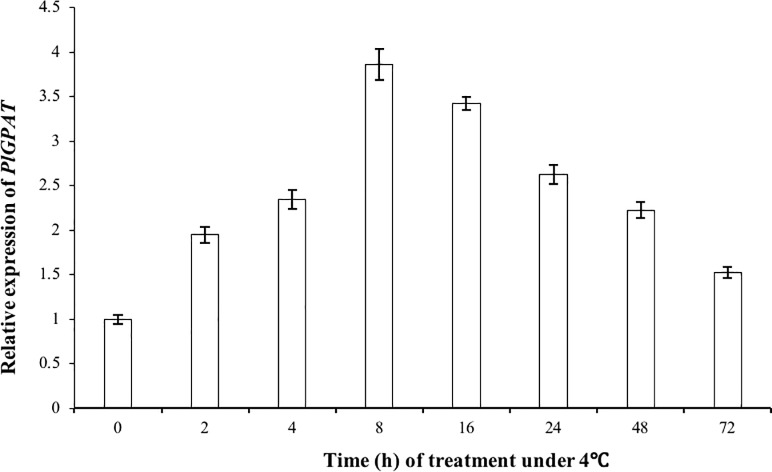
Elucidating the cold tolerance mechanism of Paeonia lactiflora, which is one of the most valuable ornamental and medicinal plants in Asia, fundamentally impacts its breeding and production. The glycerol-3-phosphate acyltransferase (GPAT) gene plays a pivotal role in cold resistance in a variety of plant species. Here, we cloned the P. lactiflora GPAT gene, determined its expression pattern, and tested its role in cold resistance. We obtained the full-length P. lactiflora GPAT gene using tissue-cultured seedlings and real-time polymerase chain reaction and rapid amplification of cDNA ends analyses. We named this gene PlGPAT in P. lactiflora. Phylogenetic analysis indicates that the PlGPAT gene is closely related with the GPAT genes in core eudicots. The phylogenetic tree containing 31 angiosperm species based on GPAT protein sequences is largely consistent with the known phylogeny in flowering plants. We conducted a time-course PlGPAT expression analysis and demonstrated that PlGPAT expression is correlated with low-temperature stress. Our results suggest that the PlGPAT gene plays an important role in regulating cold resistance in P. lactiflora.


Conflict of interest statement

The authors have declared that no competing interests exist.

Figures

Fig 1
Fig 1. Isolating the glycerol-3-phosphate acyltransferase (GPAT) gene fragments.
(a) The expressed sequence tag (EST) is a 731 bp fragment. M: DNA marker; lane 1: Polymerase chain reaction (PCR) product. (b) 3′-Rapid amplification of cDNA ends (RACE) 1,005 bp fragment. M: DNA marker; lane 2: PCR product. (c) 5′-RACE 593 bp fragment. M: DNA marker; lane 3: PCR product. (d) The 1,359 bp fragment including the open reading frame (ORF). M: DNA marker; lane 4: PCR product.
Fig 2
Fig 2. Full-length Paeonia lactiflora glycerol-3-phosphate acyltransferase gene (PlGPAT) nucleotide and translated amino acid sequences.
The amino acid sequences are indicated by the single letter code. The potential translation initiation codon (ATG) is underlined and the termination codon is marked with an asterisk. The different color boxes represent three regions that are relatively conserved when comparing PlGPAT to homologous sequences in other plants.
Fig 3
Fig 3. Conserved domains in PlGPAT detected using the NCBI Conserved Domains Search.
The deduced 448-amino-acid sequence was used for the search. Two conserved regions including the GPAT_N domain (protein sequence in the blue box) and the LPLA T_GPAT domain, as well as the PLN02349 (protein sequence in the red box), are predicted.
Fig 4
Fig 4. Molecular phylogenetic tree using the maximum likelihood method for the GPAT gene from 31 flowering plant species.
The evolutionary phylogram tree was inferred using the Maximum Likelihood method based on the General Reverse Transcriptase model. The tree with the highest log likelihood (-8282.0517) is shown. Initial tree(s) for the heuristic search were obtained automatically by applying the Neighbor-Joining and BioNJ algorithms with a matrix of pairwise distances estimated using the JTT model, and then selecting the topology with a superior log-likelihood value. A discrete Gamma distribution was used to model the evolutionary rate differences among sites (5 categories (+G, parameter = 1.2311)). The rate variation model allowed for some sites to be evolutionarily invariable ([+I], 19.4199% sites). The tree is drawn to scale, with branch lengths measured as the number of substitutions per site. The tree was rooted using Amborella trichopoda as an outgroup. Bootstrap supports (%) with >50% are shown above branches.
Fig 5
Fig 5. Relative PlGPAT gene expression levels at different time points under 4°C treatment.
Transcripts for all samples were assessed by real-time quantitative polymerase chain reaction. Relative GPAT gene expression is shown as the ratio of GPAT mRNA/β-actin mRNA normalized to the GPAT gene expression level in the control group.

References

    1. Christenhusz MJM, Byng JW (2016) The number of known plants species in the world and its annual increase. Phytotaxa 261: 201–217.
    1. Yu X, Yuan Q, Song H (2011) Comparison on the cultivation and application histories of herbaceous Peony and its flower cultures in China and western countries. Chinese Landscape Architecture 27: 77–81.
    1. Chen X, Zhang T, Liu Z (2010) Effect of electric conductivity by cold resistance of 10 perennial flowers. Northern Horticulture 10: 121–122.
    1. Wang Q, Cheng TR, Yu XN, Jaime A. Teixeira da S, David HB(2014) Physiological and biochemical responses of six herbaceous peony cultivars to cold stress. South African Journal of Botany 94: 140–148.
    1. Wang Q, Yu XN (2015) Physiological response to low temperature stress and evaluation of cold resistance of three herbaceous peony cultivars. Journal of Anhui Agri 43: 11–14.

Publication types

Substances

LinkOut - more resources