

Published Erratum
doi: 10.1016/j.ygyno.2018.07.015.
Epub 2018 Aug 7.
Corrigendum to "Single cell sequencing reveals heterogeneity within ovarian cancer epithelium and cancer associated stromal cells" [Gyncol. Oncol. 144 (2017) 598-606]
Affiliations
- PMID: 30097329
- PMCID: PMC6151286
- DOI: 10.1016/j.ygyno.2018.07.015
Item in Clipboard
Published Erratum
Corrigendum to "Single cell sequencing reveals heterogeneity within ovarian cancer epithelium and cancer associated stromal cells" [Gyncol. Oncol. 144 (2017) 598-606]
Gynecol Oncol.
2018 Oct.
No abstract available
Figures

Three clusteringmethods reveal twomajor groups of cells. A)Unsupervised hierarchical clustering based on 399 variably
expressed genes. B) K-means clustering using the same 399 genes. C & D) Principle component analysis (PCA) 3D plot of 66 cells
based on first three principle components analysis using 4,272 highly expressed genes. Cells are colored in C) based on color bar
underneath hierarchical clustering heat map. Cells in D) are colored based on K-means color bar. The two major groups defined by
unsupervised hierarchical clustering and kmeans clustering (Group 1 = blue/lightblue vs Group 2 = red/lightred) are identical
except for two cells.

High expression levels of 8 ECM-related-genes define cell subpopulations. PCA plots using 4,272 genes × 66 samples
with cells colored based on average expression levels of A) 8 highly variably expressed ECMgenes, and B) EMT transcription factors
(TWIST, SNAIL, ZEB). Red=high, yellow=medium, blue=low. C) PAX8 high in green.D) CA125 (MUC16) high in black.
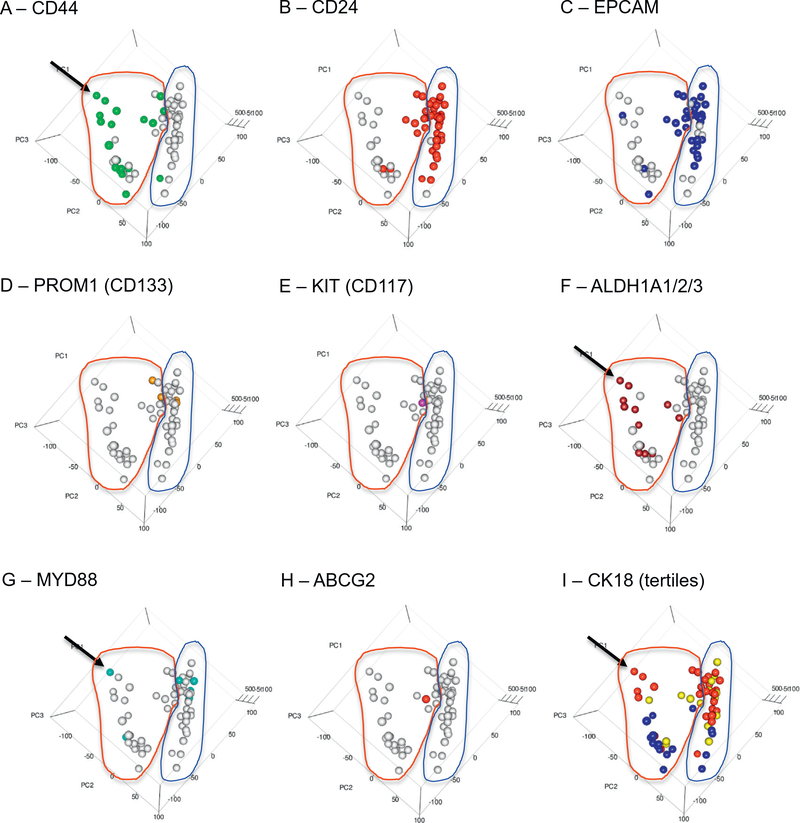
PCA plots of all 66 cells colored based on expressionof the indicatedstemcell gene. A) CD44 ingreen. B) CD24 in red. C)
EPCAMinblue. D) PROM1inyellow. E) KIT in pink. F) ALDH1A1, ALDH1A2 and ALDH1A3 in brown. G)MYD88 in cyan. H) ABCG2 in red. In A-H,
cells are colored if expression of the indicated gene(s) is > 2 (Log2 TPM+1), otherwise cells are in white. I) CK18
expression based on expression tertiles: low/none =blue, middle =yellow, high= red. Red and blue circles delineate stroma and
epithelial subgroups identified in Fig. 1, respectively.

Pie charts depicting distribution of single cells based on molecular subtype. A) Epithelial group cells (n = 39) and B)
Stroma group cells (n = 27). Differentiated = green, proliferative= blue, mesenchymal= red, immunoreactive = yellow.

PCA plot with single cells colored based on presence of functional markers: Cancer epithelial cells (dark blue), cancer
EMP cells (blue), cancer EMT cells (yellow), non-cancer EMP cells (red), fibroblasts (activated = black, not activated = grey),
and myofibroblasts (activated=dark green, not activated=light green).
Erratum for
-
Single cell sequencing reveals heterogeneity within ovarian cancer epithelium and cancer associated stromal cells.Gynecol Oncol. 2017 Mar;144(3):598-606. doi: 10.1016/j.ygyno.2017.01.015. Epub 2017 Jan 19. Gynecol Oncol. 2017. PMID: 28111004 Free PMC article.
References
Publication types
Grants and funding
LinkOut - more resources
Full Text Sources
Other Literature Sources
