. 2018 Dec;59(12):1877-1884.
doi: 10.2967/jnumed.118.214437. Epub 2018 Aug 10.

Evaluation of 18F-RO-948 PET for Quantitative Assessment of Tau Accumulation in the Human Brain

Affiliations

Evaluation of 18F-RO-948 PET for Quantitative Assessment of Tau Accumulation in the Human Brain

Hiroto Kuwabara et al. J Nucl Med. 2018 Dec.

Abstract

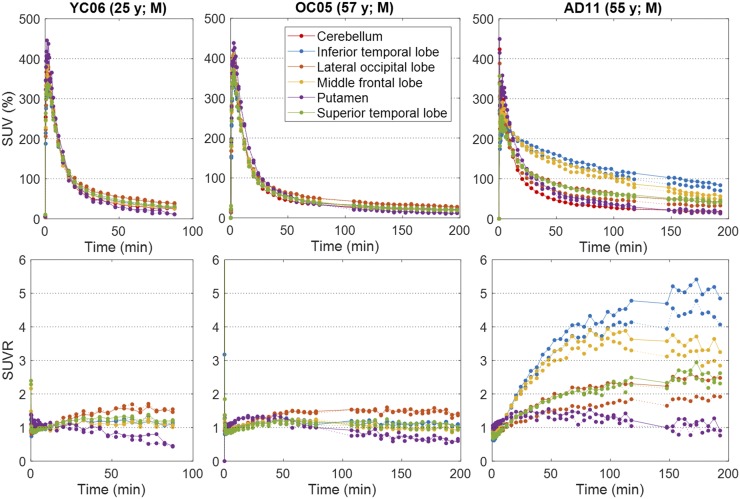
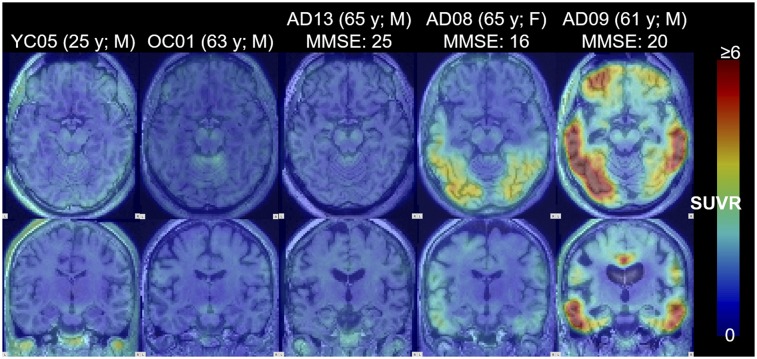
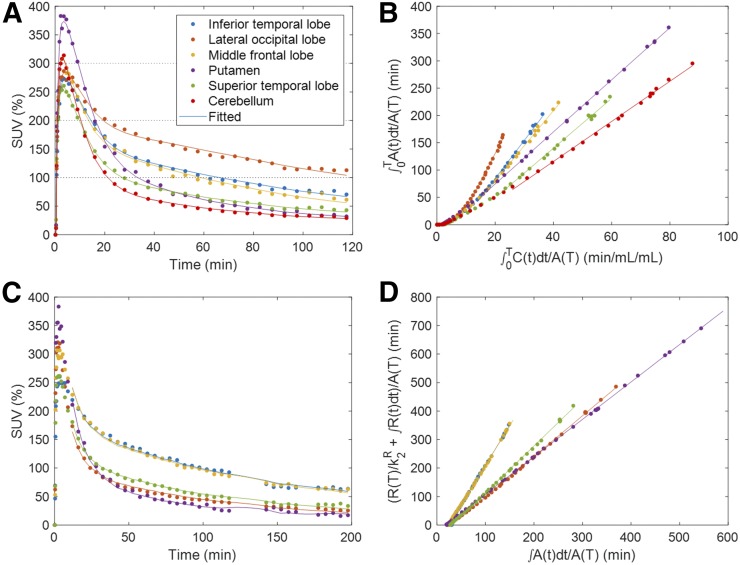
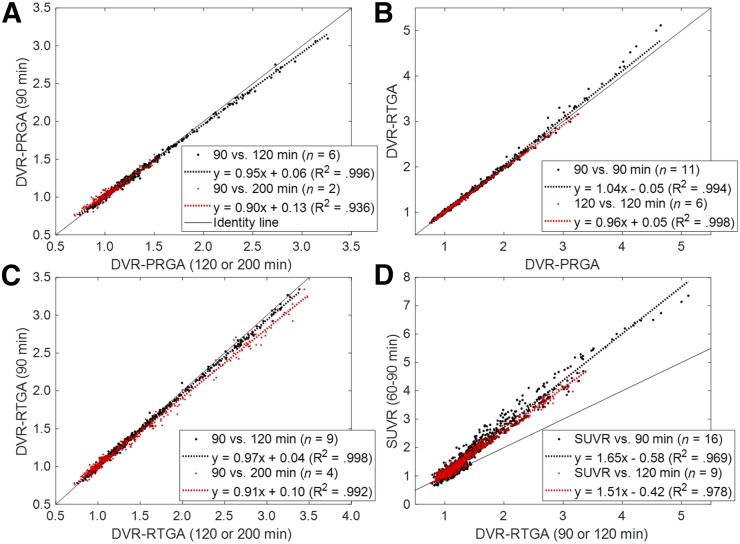
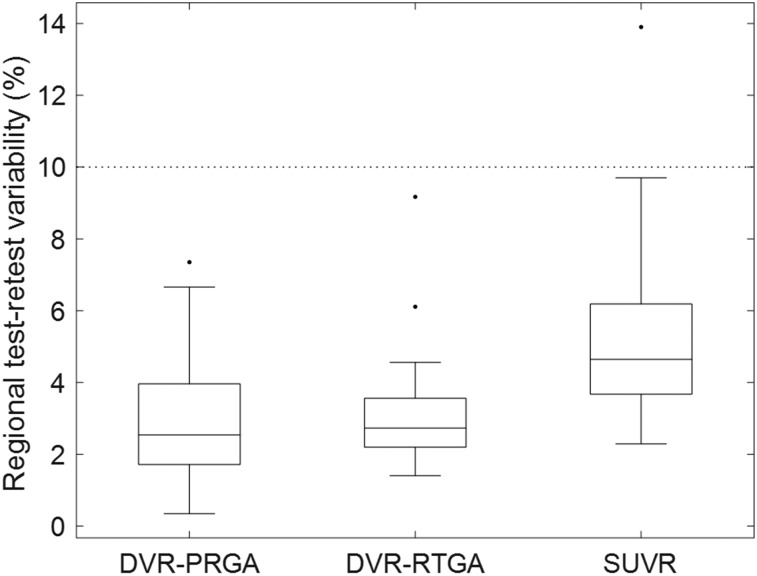
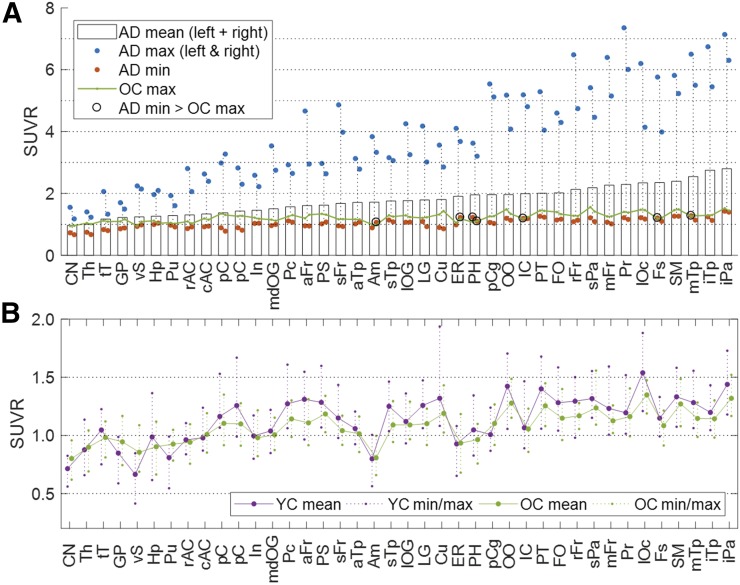
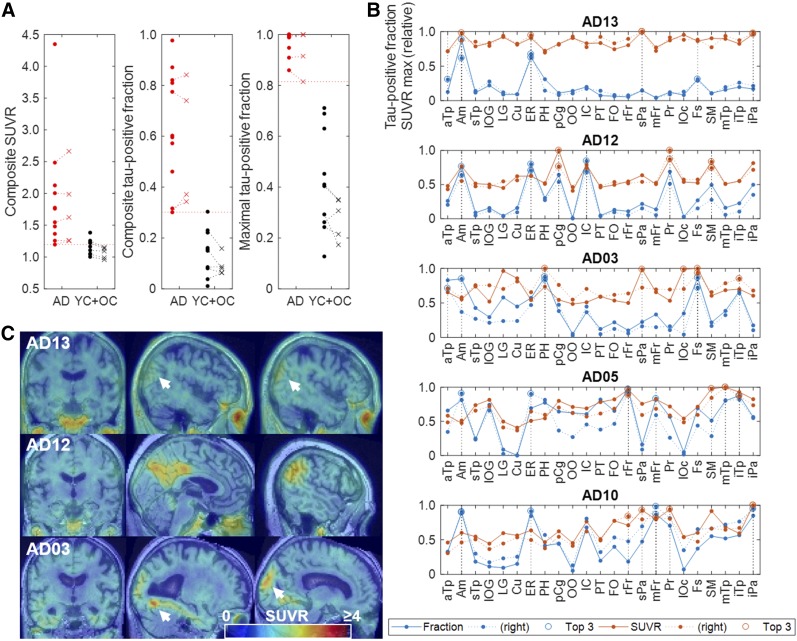
The availability of tau PET radioligands enables quantitative assessment of tau density and distribution in the human brain. We evaluated the kinetics of a novel radioligand, 18F-RO-948 (previously referred to as 18F-RO6958948), and its ability to identify tau positivity in individual patients with mild Alzheimer disease (AD). Methods: Eleven subjects with amyloid-positive mild AD, 5 amyloid-negative older control subjects (OC), and 5 younger control subjects (YC) completed 1 or 2 (4 AD and 5 OC) PET scans with 18F-RO-948 for 90, 120, or 200 min. The kinetics of the radioligand was evaluated with standard compartmental and noncompartmental models (with plasma data in 70% of cases), tissue-reference methods, and SUV ratio. These approaches were applied to assess the ability of 18F-RO-948 to discriminate AD subjects from OC subjects. Results: The plasma reference graphical analysis appeared to be the optimal method of quantification for 18F-RO-948, yielding strictly time-consistent values of distribution volume and distribution volume ratio at 90 min against the analyses at 120 and 200 min. The reference tissue graphical analysis and SUV ratio were cross-validated against plasma reference graphical analysis. Test-retest evaluation showed excellent reproducibility. A proposed novel index of tau load, the regional tau-positive fraction, showed high values in the medial and lateral temporal and parietal regions in AD and successfully separated AD subjects from OC and YC subjects with a significant margin. Conclusion:18F-RO-948 appears to be a promising radioligand for quantitative imaging of tau in the brain of AD patients.

Keywords: 18F-RO6958948 for tau imaging; Alzheimer disease; PET; neurology; radiotracer tissue kinetics.


Figures

FIGURE 1.
FIGURE 1.
Plots of time–activity curves (top) and time profiles of SUVR (bottom) of 18F-RO-948 in selected brain regions for representative subjects. Solid lines = left side of brain; dotted lines = right side of brain.
FIGURE 2.
FIGURE 2.
Images of SUVR (60–90 min) of 18F-RO-948 for representative YC, OC, and 3 levels (by mean SUVR) of AD subjects. Transaxial images (top) show medial and lateral temporal regions, and coronal images (bottom) were cut through uncus. Maximal SUVR for display was set at 6. MMSE = mini-mental state examination score.
FIGURE 3.
FIGURE 3.
Plots of observed and model-predicted tissue time–activity curves (TACs) of 2-tissue-compartmental model (A), PRGA (B), multilinear reference tissue method with 2 parameters (C), and RTGA (D) for AD subjects who had highest mean SUVRs with (A and B) and without (C and D) arterial plasma data. A(T), R(T), and C(T) stand for TACs in target and reference regions and in plasma, and k2R for the brain-to-blood clearance constant of the reference region.
FIGURE 4.
FIGURE 4.
(A) Scatterplot of regional DVR data for PRGA at 90 min (y) vs. 120 and 200 min. (B and C) Scatterplots of regional DVR data for RTGA (y) vs. PRGA at 90 and 120 min (B) and for RTGA at 90 min (y) vs. 120 and 120 min (C). (D) Scatterplot of SUVR data (y) vs. DVR data for RTGA at 90 and 120 min (D). Regression equations are shown in keys.
FIGURE 5.
FIGURE 5.
Box plot of regional test–retest variability estimates for PRGA and RTGA (variable: DVR) and SUVR for AD subjects in regions where mean SUVR exceeded 1.5 (56 left and right regions). Boxes indicate median value and upper 25th and 75th percentiles, and whiskers indicate highest and lowest values, excluding outliers (black dots; data points exceeding ±2.7 SDs). Dotted line indicates desired test–retest variability level of 10%.
FIGURE 6.
FIGURE 6.
(A) Histogram of mean SUVR for AD subjects in ascending order, together with plots of minimal and maximal values for AD subjects (in left and right sides of brain), and maximal values for OC subjects. (B) Line plot of mean SUVR for OC and YC subjects (left and right sides of brain merged), together with plots of respective minimal and maximal values. Key to abbreviated brain regions is in Table 2.
FIGURE 7.
FIGURE 7.
(A) Scatterplots of composite SUVR and TPFs, and maximal tau-positive fractions of individual subjects in baseline (dots) and retest (x) scans of AD and OC + YC subjects. (B) Line plots of TPRs and maximal SUVRs of individual regions (showing highest 23 regions alone) for 5 subjects who showed lowest composite SUVR and TPRs. Three regions (per side of brain) that had highest TPF or relative SUVRs are separately shown by circles and denoted in key as Top 3. (C) SUVR images of 3 mildest cases showing locations where maximal SUVRs were observed. Key to abbreviated brain regions is in Table 2.

References

    1. Villemagne VL, Fodero-Tavoletti MT, Masters CL, Rowe CC. Tau imaging: early progress and future directions. Lancet Neurol. 2015;14:114–124. - PubMed
    1. Iqbal K, Liu F, Gong CX. Tau and neurodegenerative disease: the story so far. Nat Rev Neurol. 2016;12:15–27. - PubMed
    1. Braak H, Braak E. Diagnostic criteria for neuropathologic assessment of Alzheimer’s disease. Neurobiol Aging. 1997;18(suppl):S85–S88. - PubMed
    1. Delacourte A, David JP, Sergeant N, et al. The biochemical pathway of neurofibrillary degeneration in aging and Alzheimer’s disease. Neurology. 1999;52:1158–1165. - PubMed
    1. Braak H, Alafuzoff I, Arzberger T, Kretzschmar H, Del Tredici K. Staging of Alzheimer disease-associated neurofibrillary pathology using paraffin sections and immunocytochemistry. Acta Neuropathol (Berl). 2006;112:389–404. - PMC - PubMed

Publication types

MeSH terms