. 2018 Aug 10;9(1):3209.
doi: 10.1038/s41467-018-05681-9.

Commensal microflora-induced T cell responses mediate progressive neurodegeneration in glaucoma

Affiliations

Commensal microflora-induced T cell responses mediate progressive neurodegeneration in glaucoma

Huihui Chen et al. Nat Commun. .

Erratum in

Abstract

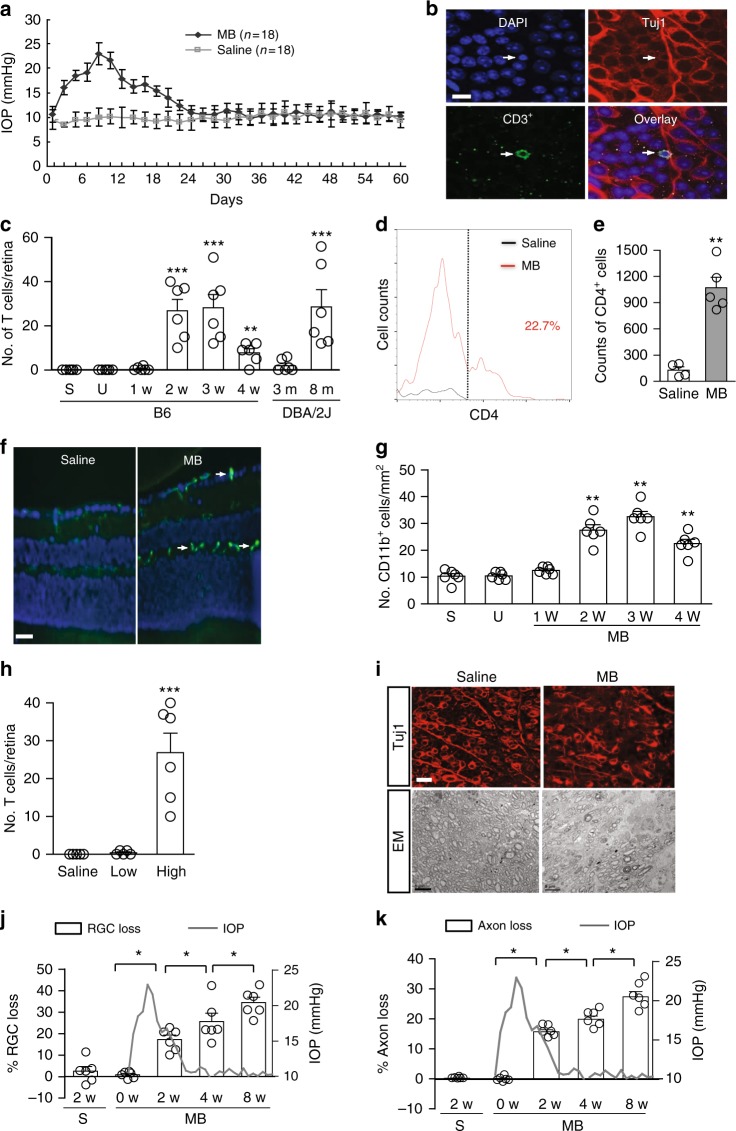
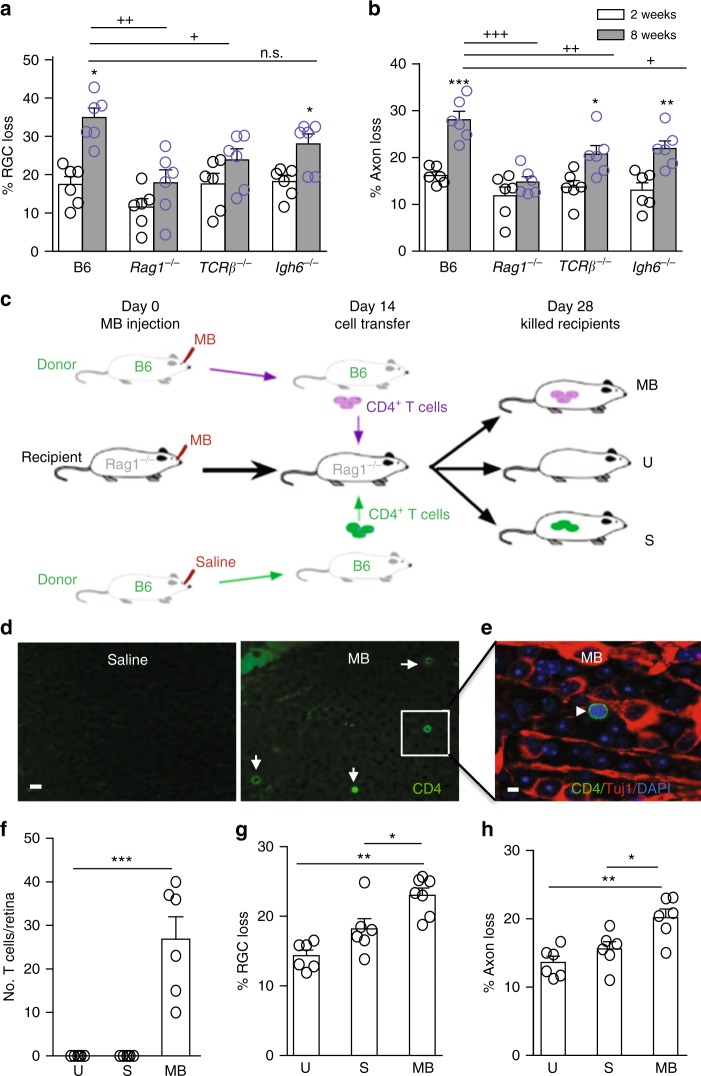
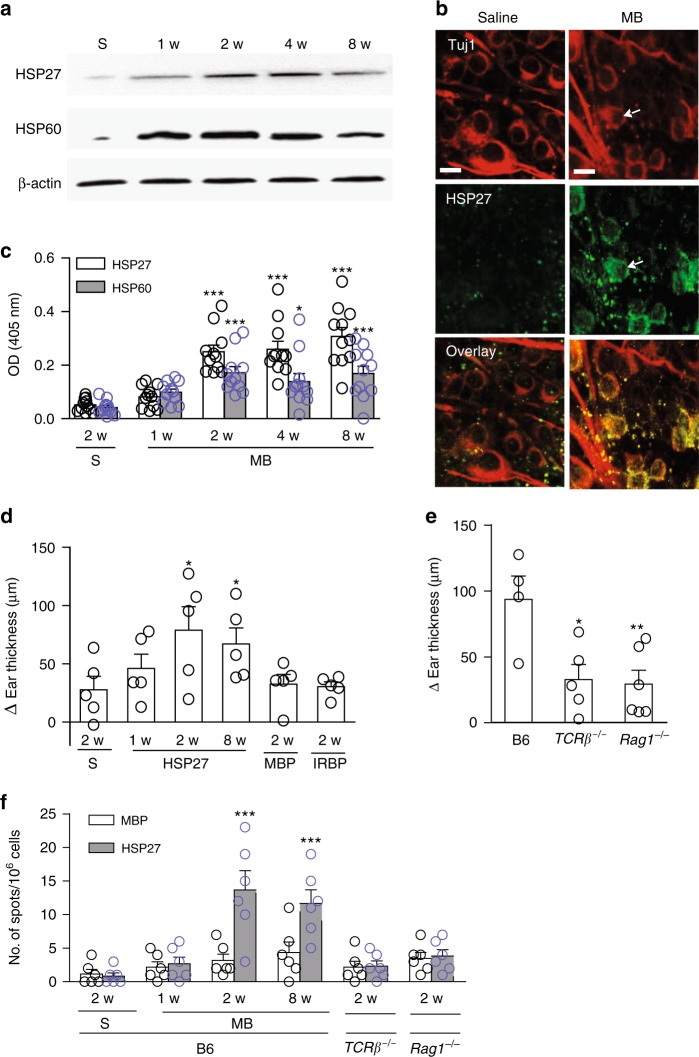
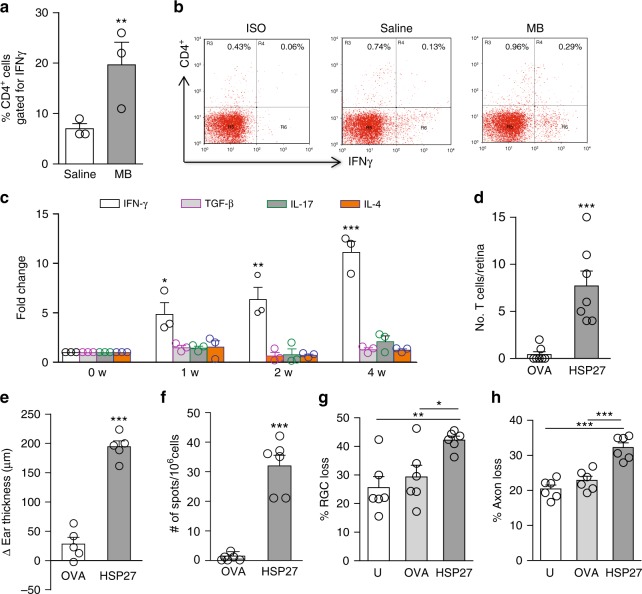
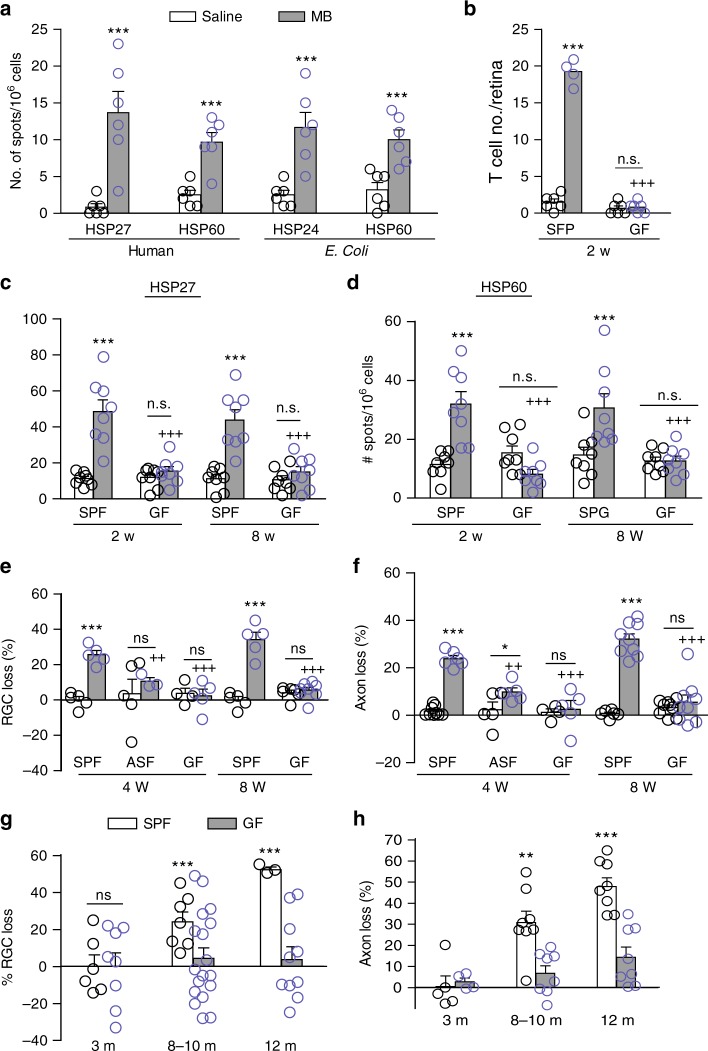
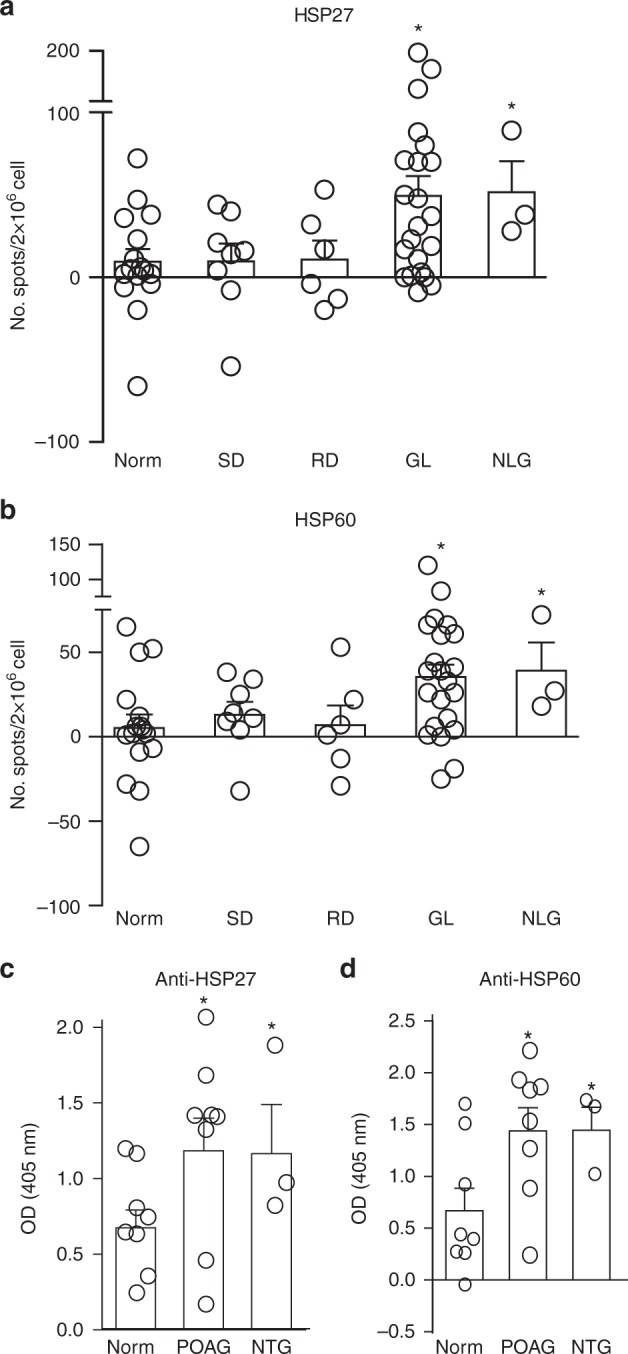
Glaucoma is the most prevalent neurodegenerative disease and a leading cause of blindness worldwide. The mechanisms causing glaucomatous neurodegeneration are not fully understood. Here we show, using mice deficient in T and/or B cells and adoptive cell transfer, that transient elevation of intraocular pressure (IOP) is sufficient to induce T-cell infiltration into the retina. This T-cell infiltration leads to a prolonged phase of retinal ganglion cell degeneration that persists after IOP returns to a normal level. Heat shock proteins (HSP) are identified as target antigens of T-cell responses in glaucomatous mice and human glaucoma patients. Furthermore, retina-infiltrating T cells cross-react with human and bacterial HSPs; mice raised in the absence of commensal microflora do not develop glaucomatous T-cell responses or the associated neurodegeneration. These results provide compelling evidence that glaucomatous neurodegeneration is mediated in part by T cells that are pre-sensitized by exposure to commensal microflora.


Conflict of interest statement

H.C., K.-S.C., D.F.C., and J.C. are co-inventors on a pending patent application for targeting T cells and microbiome for optic neuropathy therapy. The other authors declare no competing interests.

Figures

Fig. 1
Fig. 1
A transient IOP elevation induces T-cell infiltration and progressive RGC and axon loss. a IOP levels in MB- or saline-injected B6 mice (n = 18/group). b Retinal T-cell infiltration post MB injection. Retinal flat-mounts from mice 3 weeks after MB injection were stained with Tuj1 (red), an anti-CD3 antibody (green; arrow), and DAPI (blue). Scale bar: 10 µm. c Quantification of CD3+ T cells in retinas of uninjected mice (U), mice 3 weeks after saline injection (S), or 1–4 weeks (w) after MB injection (n ≥ 6/group), and DBA/2J mice at 3 or 8 (n = 6/group) months (m) old. **P < 0.01, ***P < 0.001 as compared to saline-injected group or between 3- and 8-month-old DBA/2J mice. d Flow cytometry plot of retinal cells double-immunolabeled for IFN-γ and CD4; cell count was gated for IFN-γ-secreting cells. e Quantification of CD4+ T cells by flow cytometry 2 weeks post saline or MB injection (n = 5/group). Mice were perfused with saline. CD4+ cell counts were obtained by multiplying total cells recovered from the retina with percentage of CD4+ cells. **P < 0.01 by t-test (n = 6/group). f Representative photomicrographs of retinal sections labeled with anti-CD11b (green; arrow) and counter-stained with DAPI (blue). Scale bar: 20 µm. g Quantification of CD11b+ cells at 1–4 weeks post MB injection, 3 weeks post saline (S) injection, and in uninjected (U) mice. **P < 0.01 as compared to saline-injected group (n = 6/group). h Quantification of infiltrated T cells in the retinas of mice 2 weeks after a saline, low (Low; 2.0 × 106 beads/eye) or high (High; 5.0 × 106 beads/eye) dose of MB injection. ***P < 0.001 as compared to saline-injected group (n = 6/group). i Representative Tuj1-stained epifluorescence photomicrographs of retinal flat-mounts (Tuj1) and electron microscopy (EM) of optic nerve cross sections from mice 8 weeks after saline or MB injection. Scale bar for Tuj1 and EM: 10 and 50 µm, respectively. j, k Progressive loss of RGCs and axons in MB-injected mice. RGCs were counted in Tuj1-stained retinal flat-mounts and axons in optic nerve cross sections. Shown are percentage of RGC (h) and axon (i) loss. The latter is overlaid with changes in IOP levels in MB-injected eyes. *P < 0.05, **P < 0.01, ***P < 0.001 by ANOVA as compared to saline-injected mice (n = 6/group)
Fig. 2
Fig. 2
T cells are required for the prolonged retinal neurodegeneration. a, b Quantification of RGC (a) and axon (b) loss in B6, Rag1−/−, TCRβ−/−, and Igh6−/− mice at 2 (white box) and 8 (gray box) weeks after anterior chamber MB injection. n.s. nonsignificant, +P < 0.05, ++P < 0.01, +++P < 0.001 by ANOVA comparing between B6 and indicated mutant mice at 8 weeks post MB injection; *P < 0.05, **P < 0.01, ***P < 0.001 by ANOVA comparing between 2 and 8 weeks post MB injection of mice with the same genotype (n = 8/group). c Scheme of adoptive CD4+ T-cell transfer. Both donor B6 and recipient Rag1−/− (Rag1−/−) mice were injected with MB or saline into the anterior chamber. Fourteen days later, CD4+ T cells were isolated from the spleens of donor mice and injected via tail vein into Rag1−/− mice that had received MB injection 14 days earlier. dh Fourteen days post cell transfer, T-cell infiltration and RGC and axon loss in Rag1−/− mice were analyzed. Retinal flat-mounts were stained with an anti-CD4 antibody (green), Tuj1 (red), and DAPI (blue). Shown are anti-CD4-stained (d) and overlay (e, from inset of d) images of retinal flat-mounts taken from Rag1−/− recipient mice receiving CD4+ T cells from saline- or MB-injected B6 mice. Arrows point to CD4+ cells. Scale bar: 25 µm (d) and 10 µm (e). Quantification of infiltrated T cells (f), and RGC (g) and axon (h) loss in glaucomatous Rag1−/− recipient mice that received no CD4+ T cells (U uninjected) or donor CD4+ T cells from saline-injected (S or normal IOP donor) and MB-injected (MB or glaucomatous donor) B6 mice 2 weeks post cell transfer. *P < 0.05; **P < 0.01 by ANOVA (n = 6/group)
Fig. 3
Fig. 3
Elevated IOP stimulates T-cell responses to HSPs. a Induction of HSP27 and HSP60 expression in the retinas following MB injection. B6 mice were injected with MB or saline and 1, 2, 4, and 8 weeks later retinas were harvested and homogenized. Cell homogenates were fractionated on SDS-PAGE and blotted with anti-HSP27, anti-HSP60, and anti-β-actin. Shown are representative western blots. b Upregulation of HSP27 in the glaucomatous retina. Retinal flat-mounts were stained with Tuj1 (red) and anti-HSP27 (green). Shown are representative epifluorescence photomicrographs taken from mice 4 weeks post injection of saline or MB. Note the extracellular and membrane-associated HSP27 signals in the MB-injected retina. Scale bar: 10 μm. c ELISA quantification of serum levels of antibodies specific for HSP27 or HSP60 in B6 mice 1, 2, 3, and 4 weeks after MB injection or 2 weeks after saline (S) injection. *P < 0.05, ***P < 0.001 by ANOVA comparing to saline-injected group (n = 10/group). d, e DTH assays for T-cell responses to HSP27. Shown are ear thickness among B6 mice under indicated conditions (d) or among B6, Rag1−/−, and TCRβ−/− mice 2 weeks after MB injection were compared (e). B6, Rag1−/−, and TCRβ−/− mice were injected with saline or MB in the anterior chamber of the eye. One, two, and eight weeks later mice were challenged with saline, HSP27, MBP, or IRBP, and ear thickness was measured 24 h later. *P < 0.05 by ANOVA compared to saline (d) or to HSP27 challenged B6 mice (e) (n ≥ 4/group). f Frequencies of HSP27-specific T-cell responses. B6, Rag1−/−, and TCRβ−/− mice were injected with saline or MB in the anterior chamber of the eye. One, two, and eight weeks later splenocytes were stimulated with HSP27 or MBP and the frequencies of IFN-γ-secreting cells were measured by ELISPOT. ***P < 0.001 by ANOVA as compared to saline- and MB-injected mice (n ≥ 6/group)
Fig. 4
Fig. 4
HSP-specific T cells infiltrate the retinas and augment glaucomatous neurodegeneration. a, b Infiltration of HSP27-specific T cells into the glaucomatous retina. Retinal cells from mice at 2 weeks post saline or MB injection were stimulated by HSP27 in culture, stained for CD4 and IFN-γ, and assayed by flow cytometry. Shown are frequencies of INF-γ+ -cells in CD4+ gated cells (a) and representative isotype control (Iso) and anti-CD4 vs. anti-IFN-γ staining profiles (b) from the retina of saline- and MB-injected mice. The numbers indicate percentages of cells in the gated regions. Note the increased number of INF-γ+ cells among CD4+ cells in MB-injected retina compared to saline-injected retina. **P < 0.01 (n = 3/group; each group was pooled from 5 mice). c qPCR quantification of IFN-γ, TGF-β, IL-17, and IL-4 transcripts in the mouse retinas before (0) and at 1, 2, and 4 weeks post MB or saline injection. **P < 0.01, ***P < 0.001 by ANOVA (n = 3/group). d Quantification of CD4+ T-cell numbers in retinal flat-mounts of glaucomatous Rag1−/− mice that received an injection of GFP+/CD4+ T cells from HSP27- or OVA-immunized mice. ***P < 0.001 (n = 6/group). e, f T-cell responses in ovalbumin (OVA)- or HSP27-immunized mice. B6 mice were immunized with HSP27 or OVA, and 2 weeks later, mice were challenged with HSP27 by intradermal injection in the ear followed by measurement of ear thickness 24 h later (e) or mouse splenocytes were isolated, stimulated with HSP27 and then IFN-γ-secreting cells were detected by ELISPOT (f). ***P < 0.001 (n = 6/group). g, h Greater loss of RGCs  (g) and axons (h) in WT recipient mice received adoptive T-cell transfer from HSP27-immunized mice. B6 mice were immunized with HSP27 or ovalbumin (OVA) and 2 weeks later CD4+ T cells were isolated from spleens of immunized mice and unimmunized (U) mice, and adoptively transferred into B6 mice that had been injected with MB 2 weeks earlier. Two weeks after cell transfer, retinal flat-mounts of recipient mice were stained with Tuj1, and RGCs were counted. **P < 0.01, ***P < 0.001 by ANOVA (n = 6/group)
Fig. 5
Fig. 5
HSP-specific T-cell responses and retinal damage are absent in germ-free mice. a Frequencies of T-cell responses to human and bacterial HSPs. Splenocytes from mice at 2 weeks post saline or MB injection were stimulated with human HSP27 and HSP60 or E. coli HSP24 and HSP60, and the frequencies of IFN-γ-secreting cells were assayed by ELISPOT (n = 6/group). b Quantification of infiltrated T cells in the retinas of SPF and GF SW mice at 2 weeks after saline or MB injection (n = 6/group). c, d Frequencies of HSP27 (c)- and HSP60 (d)-specific T cells in GF and SPF Swiss Webster mice (n ≥ 8/group). Splenocytes from GF and SPF Swiss Webster mice at 2 and 8 weeks post MB or saline injection were stimulated with human HSP27 or HSP60, and the frequencies of IFN-γ-secreting cells were assayed by ELISPOT. n.s. not significant. e, f Comparison of RGC (e) and axon (f) loss at 4 and 8 weeks after MB injection in SPF, ASF, and GF Swiss Webster mice. *P <0.05; ***P < 0.001 over saline-injected group; ++P < 0.01; +++P < 0.001 over MB-injected SPF mice at the indicated time points. n.s. not significant (n = 8/group). g, h Comparison of RGC (g) and axon (h) loss in SPF and GF DBA/2J mice at 3 (n = 16), 8–10 (n = 24), and 12 (n = 12) months of age. n.s. not significant; **P < 0.01, ***P < 0.001 by ANOVA
Fig. 6
Fig. 6
T cells are involved in retinal neurodegeneration in human glaucoma patients. a, b Comparison of frequencies of HSP27- and HSP60-specific T cells among healthy individuals and patients with POAG or other diseases. Peripheral blood mononuclear cells from patients with POAG (n = 18), NTG (n = 3), retinal detachment (RD; n = 6), skin injuries (SD; n = 8), and age-matched healthy controls (Norm; n = 16) were stimulated with HSP27 (a) or HSP60 (b). Two days later, the frequencies of IFN-γ-secreting cells were determined by ELISPOT. *P < 0.05 by ANOVA. c, d Comparison of serum levels of HSP27- and HSP60-specific IgGs between healthy individuals and patients with POAG or NTG. Sera from POAG (n = 18), NTG (n = 3), and age-matched healthy individuals (Norm, n = 16) were assayed for HSP27- and HSP60-specific IgG by ELISA. *P < 0.05 by ANOVA

Comment in

References

    1. Quigley HA, Broman AT. The number of people with glaucoma worldwide in 2010 and 2020. Br. J. Ophthalmol. 2006;90:262–267. doi: 10.1136/bjo.2005.081224. - DOI - PMC - PubMed
    1. McKinnon SJ, Goldberg LD, Peeples P, Walt JG, Bramley TJ. Current management of glaucoma and the need for complete therapy. Am. J. Manag. Care. 2008;14:S20–S27. - PubMed
    1. Walland MJ, et al. Failure of medical therapy despite normal intraocular pressure. Clin. Exp. Ophthalmol. 2006;34:827–836. doi: 10.1111/j.1442-9071.2006.01368.x. - DOI - PubMed
    1. Wax MB. The case for autoimmunity in glaucoma. Exp. Eye Res. 2011;93:187–190. doi: 10.1016/j.exer.2010.08.016. - DOI - PubMed
    1. Gramlich OW, et al. Enhanced insight into the autoimmune component of glaucoma: IgG autoantibody accumulation and pro-inflammatory conditions in human glaucomatous retina. PLoS ONE. 2013;8:e57557. doi: 10.1371/journal.pone.0057557. - DOI - PMC - PubMed

Publication types

MeSH terms

Substances