. 2018 Aug 10;9(1):3212.
doi: 10.1038/s41467-018-05694-4.

Targeting AURKA-CDC25C axis to induce synthetic lethality in ARID1A-deficient colorectal cancer cells

Affiliations

Targeting AURKA-CDC25C axis to induce synthetic lethality in ARID1A-deficient colorectal cancer cells

Changjie Wu et al. Nat Commun. .

Abstract

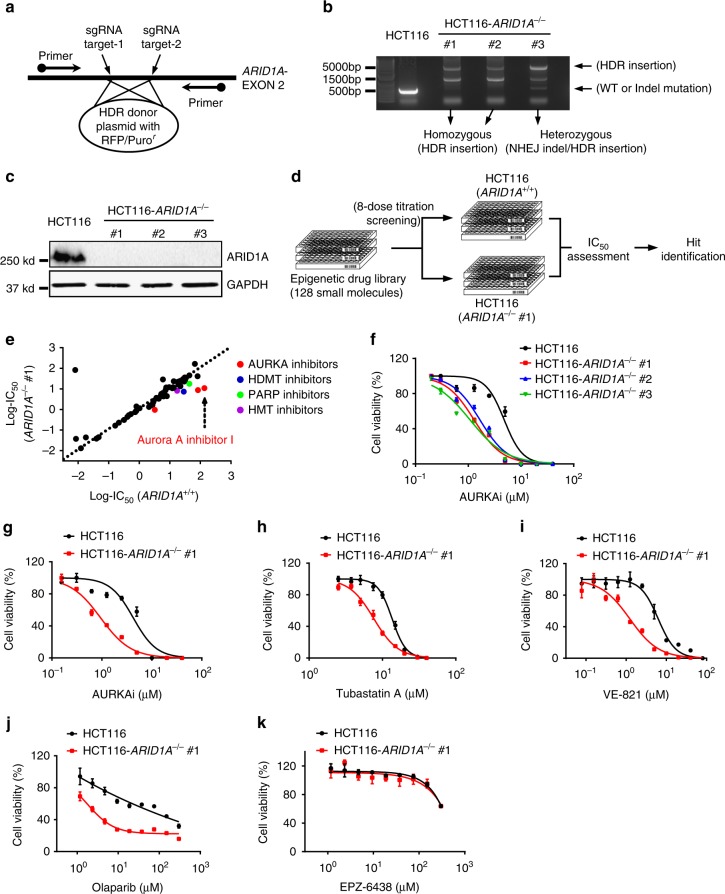
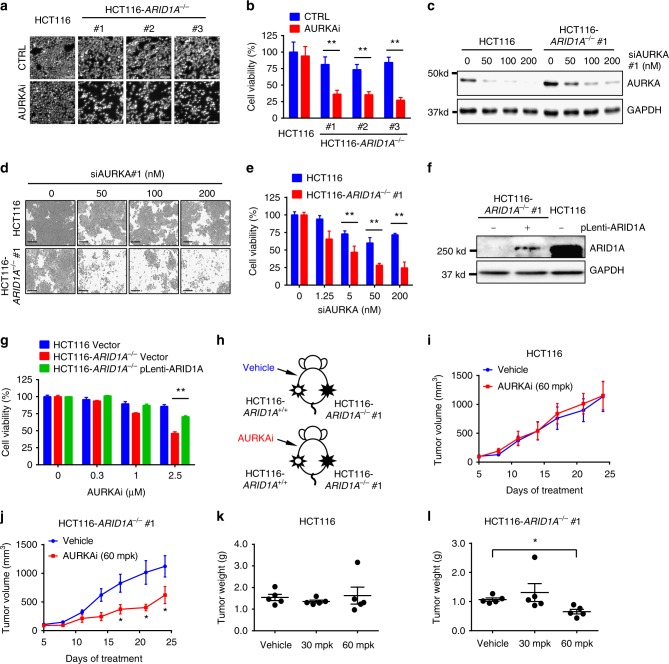
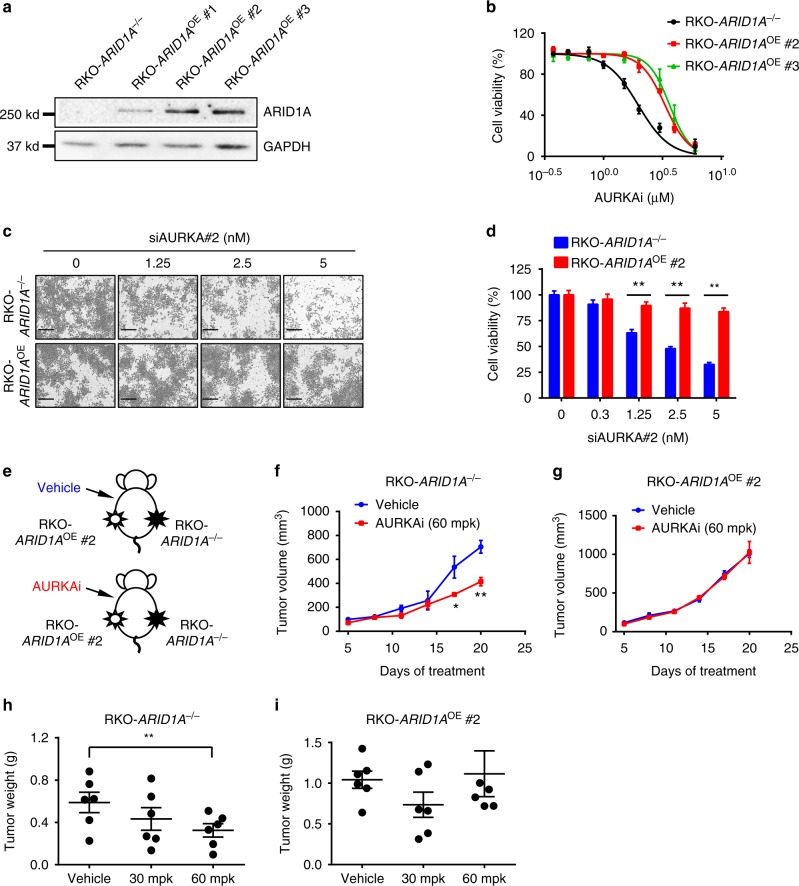
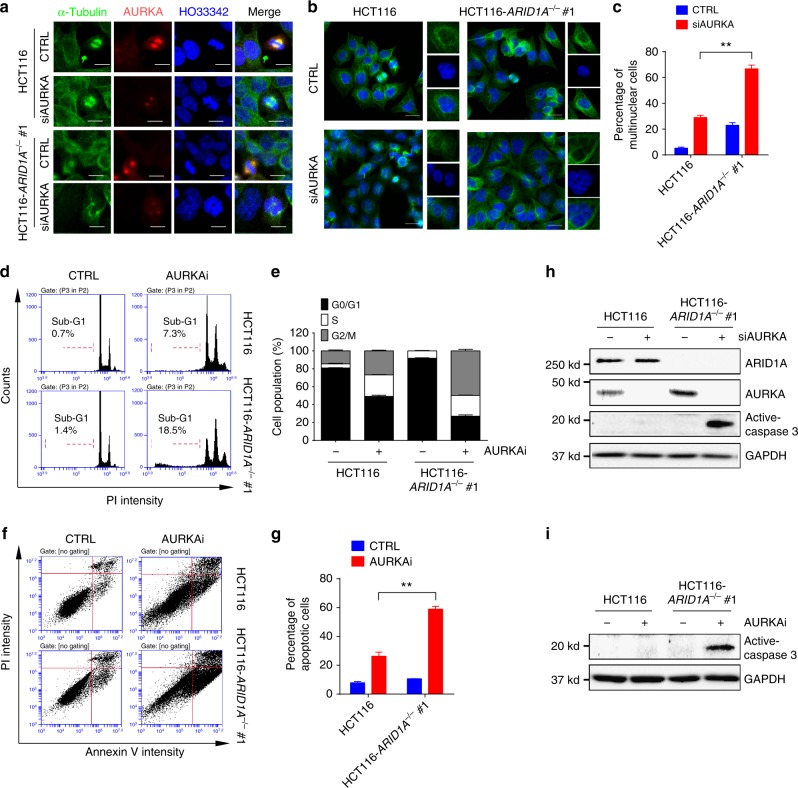
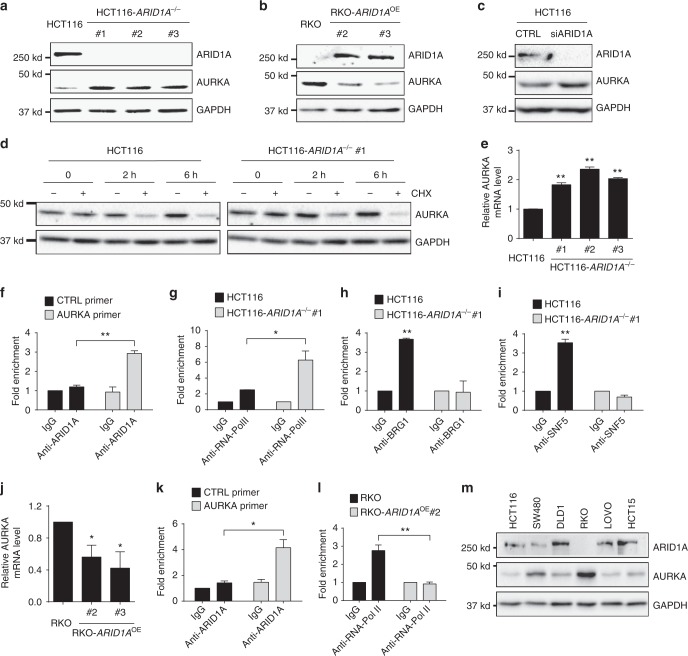
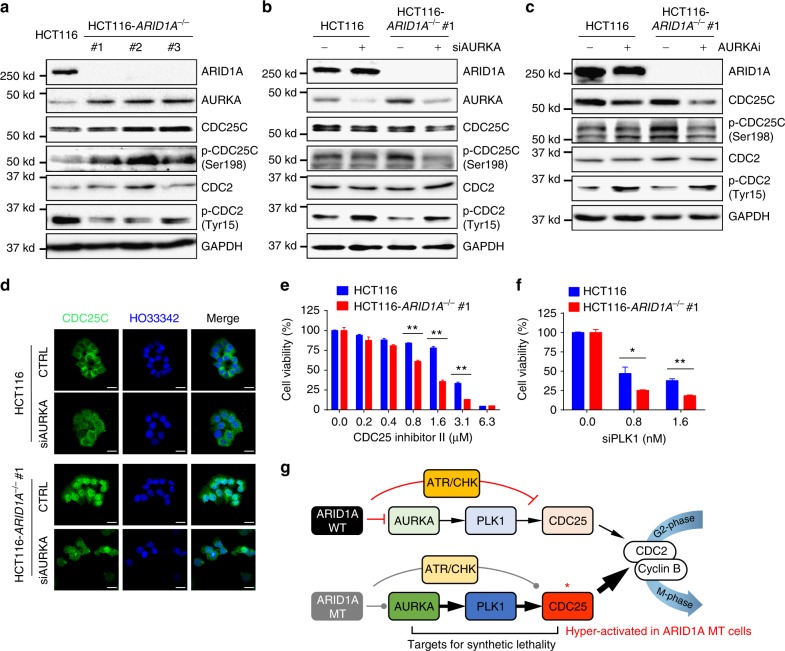
ARID1A, a component of the SWI/SNF chromatin remodeling complex, is a tumor suppressor with a high frequency of inactivating mutations in many cancers. Therefore, ARID1A deficiency has been exploited therapeutically for treating cancer. Here we show that ARID1A has a synthetic lethal interaction with aurora kinase A (AURKA) in colorectal cancer (CRC) cells. Pharmacological and genetic perturbations of AURKA selectively inhibit the growth of ARID1A-deficient CRC cells. Mechanistically, ARID1A occupies the AURKA gene promoter and negatively regulates its transcription. Cells lacking ARID1A show enhanced AURKA transcription, which leads to the persistent activation of CDC25C, a key protein for G2/M transition and mitotic entry. Inhibiting AURKA activity in ARID1A-deficient cells significantly increases G2/M arrest and induces cellular multinucleation and apoptosis. This study shows a novel synthetic lethality interaction between ARID1A and AURKA and indicates that pharmacologically inhibiting the AURKA-CDC25C axis represents a novel strategy for treating CRC with ARID1A loss-of-function mutations.


Conflict of interest statement

The authors declare no competing interests.

Figures

Fig. 1
Fig. 1
Generation of ARID1A-knockout (KO) HCT116 cells and screening of epigenetic drug library for synthetic lethality. a Illustration for sgRNA target sites on ARID1A exon 2 for HDR donor plasmid insertion and primers designed for Sanger sequencing. b PCR amplification of ARID1A exon 2 using the designed primers in HCT116 ARID1A+/+ and three ARID1A−/− clones. ARID1A−/− clones #1 and #2 are homozygous ARID1A-KO with HDR donor plasmid insertion into ARID1A gene. Clone #3 is a heterozygous ARID1A−/− containing a HDR insertion mutation and an NHEJ Indel mutation. c Immunoblot analysis showing loss of ARID1A expression in the three ARID1A−/− clones. d Schematic illustration of the synthetic lethality epigenetic drug screening. HCT116 ARID1A+/+ and ARID1A−/− #1 cell lines were screened in parallel with 128 epigenetic drug library in an 8-dose titration format. After incubation with the drug library for 72 h, cell viability was determined by AlamarBlue assay. e A log10-IC50 plot of the screening results. A log10 scale of IC50 values of the drugs against HCT116 ARID1A+/+ and ARID1A−/− cells was plotted. Drugs with selectivity index (SI) > 2 for ARID1A−/− cells were selected and marked as synthetic lethality candidates. f Dose–response curves of HCT116 ARID1A+/+ and three ARID1A−/− clones treated with Aurora A inhibitor I (AURKAi) for 72 h are shown. Error bars represent s.d. (n = 9) from three independent experiments. Survival curve of all three KO clones versus wild-type cells P value < 0.0001, ANOVA. gk Dose–response curves of HCT116 ARID1A isogenic cell pair treated with AURKAi (g) and known synthetic lethality compounds for ARID1A, including tubastatin A (HDAC6 inhibitor) (h), VE-821 (ATR inhibitor) (i), olaparib (PARP inhibitor) (j), and EPZ-6438 (EZH2 inhibitor) (k), are shown. HCT116 ARID1A+/+ and ARID1A−/− #1 clone were incubated with indicated compounds for 72 h and the cell viability was determined by AlamarBlue assay. Error bars represent s.d. (n = 9) from three independent experiments. ANOVA P value of <0.0001 for AURKAi, tubastatin A, VE-821, and olaparib. ANOVA P value of 0.1629 for EPZ-6438
Fig. 2
Fig. 2
In vitro and in vivo synthetic lethality in ARID1A-KO HCT116 cells by AURKA inhibition. a Synthetic lethality in ARID1A−/− HCT116 cells by AURKAi. ARID1A+/+ HCT116 or three ARID1A−/− clones were treated with 1 μM AURKAi for 72 h and nuclei were stained with Hoechst 33342. Scale bars, 100 µm. b Nuclear density was measured with Image J software as a surrogate for cell viability. Error bars represent s.d. **P < 0.01, Student’s t test. c Silencing of AURKA expression in ARID1A isogenic cell pair by siRNA (siAURKA#1). GAPDH was used as a loading control. d Synthetic lethality in ARID1A−/− HCT116 cells by AURKA siRNA. ARID1A+/+ or ARID1A−/− clone was transfected with various concentrations of AURKA siRNA for 72 h and the cell images were taken with IncuCyte ZOOM. Scale bars, 300 µm. e Integrated density was measured with the IncuCyte ZOOM software as a surrogate for cell viability. Error bars represent s.d. **P < 0.01, Student’s t test. f Ectopic overexpression of ARID1A (pLenti-ARID1A) in ARID1A−/− HCT116 cells. g Overexpression of ARID1A reversed the synthetic lethality effect by AURKAi. ARID1A+/+ HCT116, ARID1A−/− HCT116, and ARID1A−/− HCT116 transfected with an ARID1A plasmid were treated with AURKAi for 72 h, and the cell viability was assessed with AlamarBlue assay. Error bars represent s.d. **P < 0.01, Student’s t test. h Schematic illustration of mouse tumor xenograft experiments with HCT116 ARID1A isogenic cell pair. i, j Tumor growth curve in nude mice bearing ARID1A+/+ HCT116 (i) or ARID1A−/− HCT116 (j) xenografts after injection of vehicle or 60 mg kg−1 (mpk) AURKAi. Error bars represent s.d. *P < 0.05 between vehicle and AURKAi treatment groups (n = 5), Student’s t test. k, l Wet weight measurement of the tumors isolated from mice bearing ARID1A+/+ HCT116 (k) or ARID1A−/− HCT116 (i) xenografts at 24 days after injection of vehicle, 30 or 60 mpk AURKAi. Error bars represent s.d. *P < 0.05 between vehicle and 60 mpk AURKAi treatment groups (n = 5), Student’s t test
Fig. 3
Fig. 3
In vitro and in vivo synthetic lethality in ARID1A−/− RKO cells by AURKA inhibition. a Stable expression of ARID1A in ARID1A−/− RKO cells using a lentiviral transduction. Three selected ARID1A stable clones are shown. b Dose–response curves of ARID1A−/− parental RKO and ARID1A overexpressing (ARID1AOE) RKO clones treated with AURKAi. Error bars represent s.d. (n = 6) from three independent experiments. Survival curve of ARID1A−/− versus ARID1AOE cell lines, P value < 0.0001, ANOVA. c Synthetic lethality effect of AURKA siRNA (siAURKA#2) on RKO ARID1A isogenic pair. Representative cell images were taken with IncuCyte ZOOM. Scale bars, 300 µm. d Integrated cell density was measured with the IncuCyte ZOOM software as a surrogate for cell viability (right panels). Error bars represent s.d. **P < 0.01, Student’s t test. e Schematic illustration of mouse tumor xenograft experiments with RKO ARID1A isogenic cell pair. f, g Tumor growth curve in nude mice bearing ARID1A−/− RKO (f) or ARID1AOE RKO clone #2 (g) xenografts after injection of vehicle or 60 mg kg−1 (mpk) AURKAi. Error bars represent s.d. *P < 0.05; **P < 0.01 between vehicle and AURKAi treatment groups (n = 6), Student’s t test. h, i Wet weight measurement of the tumors isolated from mice bearing ARID1A−/− RKO (h) or ARID1AOE RKO clone #2 (i) xenografts at 20 days after injection of vehicle, 30 or 60 mpk AURKAi. Error bars represent s.d. **P < 0.01 between vehicle and 60 mpk AURKAi treatment groups (n = 6), Student’s t test
Fig. 4
Fig. 4
Induction of multinucleation, G2/M arrest, and apoptosis in ARID1A−/− cells by AURKA inhibition. a Abnormal chromosomal segregation induced by AURKA silencing. ARID1A isogenic HCT116 cells were transfected with AURKA siRNA and analyzed for immunofluorescence of AURKA, α-tubulin, and nuclei/chromatin (HO33342). Scale bars, 10 µm. b Induction of multinucleation in ARID1A−/− cells by AURKA silencing. ARID1A isogenic HCT116 cells were transfected with AURKA siRNA and analyzed for immunofluorescence of α-tubulin (green) and nuclei/chromatin (blue). Images in the inlets (red square) are representative cells that were magnified and shown on the right side of each figure. Scale bars, 20 µm. c Percentage of multinuclear cells in ARID1A isogenic HCT116 cells treated with AURKA siRNA. Error bars represent s.d. **P < 0.01, Student’s t test. d Cell cycle analyses of ARID1A isogenic HCT116 cells treated with AURKAi. e Percentage of cell populations in each cell cycle phase. Error bars represent s.d. f, g Preferential induction of apoptosis in ARID1A−/− cells by AURKAi. Cells with or without AURKAi treatment were subjected to FITC–Annexin V apoptosis detection with a flow cytometer (f) and the percentage of apoptotic cells were quantitated (g). Error bars represent s.d. **P < 0.01, Student’s t test. h, i Preferential induction of apoptosis in ARID1A−/− cells by AURKA silencing (h) or AURKAi treatment (i). Active (cleaved) caspase-3 was used as a marker of apoptosis induction
Fig. 5
Fig. 5
AURKA is a target gene for transcription repression by ARID1A. a Upregulation of AURKA level in ARID1A−/− HCT116 cells. b Downregulation of AURKA level in ARID1A overexpressing (ARID1AOE) RKO clones. c Upregulation of AURKA level in HCT116 cells by ARID1A silencing. d Measurement of AURKA protein half-life in ARID1A isogenic HCT116 cells. Cells were treated with or without 10 μM cycloheximide (CHX) for the indicated time points and pre-existing AURKA protein stability was analyzed. e RT-qPCR analysis of AURKA mRNA level in HCT116 ARID1A+/+ and ARID1A−/− clones. **P < 0.01 vs HCT116 (ARID1A+/+), one-sample t test. f Chromatin immunoprecipitation (ChIP) of AURKA promoter in ARID1A+/+ HCT116 cells using anti-ARID1A antibody. ChIP data were normalized to the control IgG ChIP with the control (CTRL) primer. **P < 0.01, Student’s t test. g ChIP of AURKA promoter in HCT116 ARID1A+/+ (black) and ARID1A−/− (gray) cells using anti-RNA-Pol II antibody. IgG in each cell line was used as a normalization control. *P < 0.05, Student’s t test. h ChIP of AURKA promoter in HCT116 ARID1A+/+ (black) and ARID1A−/− (gray) using anti-BRG1 antibody. IgG in each cell line was used as a normalization control. **P < 0.01 vs IgG, one-sample t test. i ChIP of AURKA promoter in HCT116 ARID1A+/+ (black) and ARID1A−/− (gray) using anti-SNF5 antibody. IgG in each cell line was used as a normalization control. **P < 0.01 vs IgG, one-sample t test. j RT-qPCR analysis of AURKA mRNA level in RKO ARID1A−/− and ARID1AOE clones. *P < 0.05 vs RKO (ARID1A−/−), one-sample t test. k ChIP of AURKA promoter in ARID1AOE RKO clone #2 using anti-ARID1A antibody. ChIP data were normalized to the control IgG ChIP with the control (CTRL) primer. *P < 0.05, Student’s t test. l ChIP of AURKA promoter in RKO ARID1A−/− (black) and ARID1AOE (gray) cells using anti-RNA-Pol II antibody. IgG in each cell line was used as a normalization control. **P < 0.01, Student’s t test. Error bars represent s.d. m Protein expression status of ARID1A and AURKA in six colorectal cancer cell panel
Fig. 6
Fig. 6
AURKA–CDC25C axis is a target for synthetic lethality in ARID1A-KO colorectal cancer cells. a Immunoblots showing upregulation of AURKA and phosphorylated CDC25C at Ser198 levels and downregulation of phosphorylated CDC2 at Tyr15 level in ARID1A−/− HCT116 cells. b, c Inhibition of CDC25C phosphorylation at Ser198 and increased phosphorylation of CDC2 at Tyr15 by AURKA silencing (b) and AURKAi treatment (c). d Immunofluorescence analysis of CDC25C localization in ARID1A isogenic cells treated with or without AURKA siRNA. Scale bars, 20 µm. e Synthetic lethality in ARID1A−/− HCT116 cells by CDC25 inhibitor II. f Synthetic lethality in ARID1A−/− HCT116 cells by PLK1 siRNA (siPLK1). Error bars represent s.d. *P < 0.05; **P < 0.01, Student’s t test. g Working model of the synthetic lethality between ARID1A and AURKA. In ARID1A wild-type (WT) cells, AURKA expression is negatively regulated by ARID1A, thereby reducing the activity of AURKA downstream pathway, including PLK1 and CDC25C. In ARID1A mutant (MT) cells, AURKA-PLK1-CDC25C pathway is upregulated. In addition, CDC25C activity is negatively regulated by ARID1A–ATR–CHK (checkpoint kinase) pathway under DNA damage conditions, thereby strictly controlling the CDC25 activity in ARID1A WT cells. In ARID1A MT cells, ARID1A–ATR–CHK pathways is impaired and thus CDC25C activity is de-repressed, causing it in hyper-active state. In this condition, cells can be addicted to AURKA–CDC25C pathway for cell survival and proliferation. Therefore, AURKA–CDC25C axis becomes a target for synthetic lethality in ARID1A-deficient cells

References

    1. Wilson BG, Roberts CW. SWI/SNF nucleosome remodellers and cancer. Nat. Rev. Cancer. 2011;11:481–492. doi: 10.1038/nrc3068. - DOI - PubMed
    1. Wang W. The SWI/SNF family of ATP-dependent chromatin remodelers: similar mechanisms for diverse functions. Curr. Top. Microbiol. Immunol. 2003;274:143–169. - PubMed
    1. Wiegand KC, et al. ARID1A mutations in endometriosis-associated ovarian carcinomas. N. Engl. J. Med. 2010;363:1532–1543. doi: 10.1056/NEJMoa1008433. - DOI - PMC - PubMed
    1. Wang K, et al. Exome sequencing identifies frequent mutation of ARID1A in molecular subtypes of gastric cancer. Nat. Genet. 2011;43:1219–1223. doi: 10.1038/ng.982. - DOI - PubMed
    1. Guichard C, et al. Integrated analysis of somatic mutations and focal copy-number changes identifies key genes and pathways in hepatocellular carcinoma. Nat. Genet. 2012;44:694–698. doi: 10.1038/ng.2256. - DOI - PMC - PubMed

Publication types

MeSH terms