. 2018 Aug 10;9(1):3213.
doi: 10.1038/s41467-018-05705-4.

Beneficial effects of climate warming on boreal tree growth may be transitory

Affiliations

Beneficial effects of climate warming on boreal tree growth may be transitory

Loïc D'Orangeville et al. Nat Commun. .

Abstract

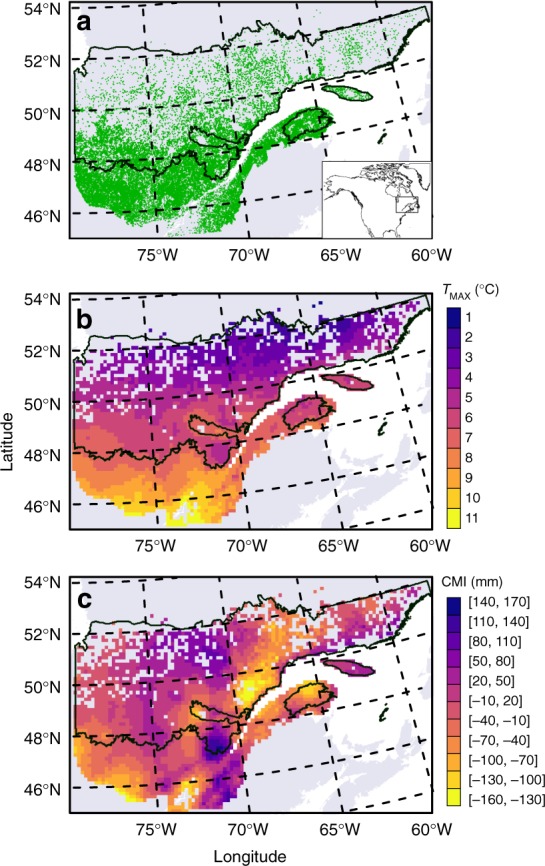
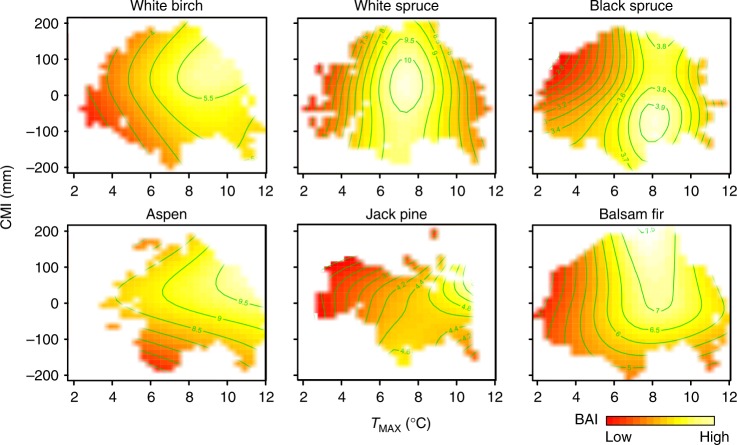
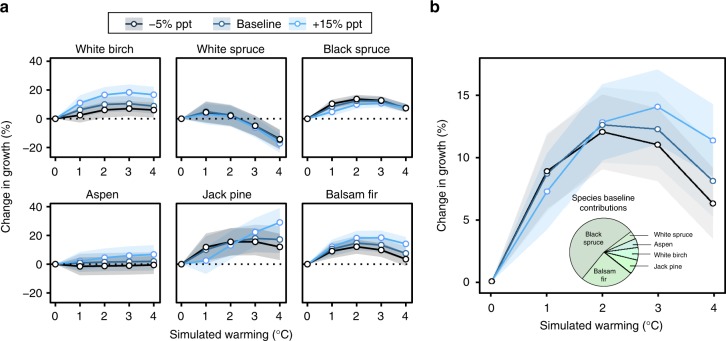
Predicted increases in temperature and aridity across the boreal forest region have the potential to alter timber supply and carbon sequestration. Given the widely-observed variation in species sensitivity to climate, there is an urgent need to develop species-specific predictive models that can account for local conditions. Here, we matched the growth of 270,000 trees across a 761,100 km2 region with detailed site-level data to quantify the growth responses of the seven most common boreal tree species in Eastern Canada to changes in climate. Accounting for spatially-explicit species-specific responses, we find that while 2 °C of warming may increase overall forest productivity by 13 ± 3% (mean ± SE) in the absence of disturbance, additional warming could reverse this trend and lead to substantial declines exacerbated by reductions in water availability. Our results confirm the transitory nature of warming-induced growth benefits in the boreal forest and highlight the vulnerability of the ecosystem to excess warming and drying.


Conflict of interest statement

The authors declare no competing interests.

Figures

Fig. 1
Fig. 1
Plot location and average climate of the study area. a Location of sampled plots (green) in Quebec, Canada (gray). b Average annual daily maximum temperature (TMAX) across sampled plots. c Growing season (May to September) climate moisture index (CMI, see Methods). The intermediate black line indicates the limit between the boreal and temperate vegetation zones while the upper black line represents the limit for commercial forestry. Variables in b, c are averaged over the study period (1985–2005) and per 15-km polygon. Data for base maps from https://www12.statcan.gc.ca/census-recensement/2011/geo/bound-limit/bound-limit-2011-eng.cfm with permission under http://open.canada.ca/en/open-government-licence-Canada and from https://www.donneesquebec.ca/recherche/fr/dataset/systeme-hierarchique-de-classification-ecologique-du-territoire used with permission under a Creative Commons 4.0—Attribution CC BY
Fig. 2
Fig. 2
Interactive effects of temperature (TMAX) and water availability (climate moisture index, CMI) on tree basal area increment (BAI). Heat plots indicate predicted tree BAI (in cm2 year−1) across observed ranges of TMAX and CMI, with all other model variables held at median species values
Fig. 3
Fig. 3
Changes in growth across Quebec’s boreal vegetation zone under future climate scenarios. Relative changes in basal area growth per hectare are calculated under scenarios of 2 and 4 °C increases in TMAX and −5 to +15% average changes in precipitation (ppt) according to local conditions (tree size, species, mean stand age, competition, soil, slope, stand successional stage, climate). Increases in TMAX are accompanied by corresponding increases in potential evapotranspiration (see Methods). Values were obtained by averaging plot-level growth modeled from stem inventory data across 15-km polygons (see Methods). Data for base maps from https://www12.statcan.gc.ca/census-recensement/2011/geo/bound-limit/bound-limit-2011-eng.cfm with permission under http://open.canada.ca/en/open-government-licence-Canada and from https://www.donneesquebec.ca/recherche/fr/dataset/systeme-hierarchique-de-classification-ecologique-du-territoire used with permission under a Creative Commons 4.0—Attribution CC BY
Fig. 4
Fig. 4
Differences in mean growth under future climate scenarios across Quebec’s boreal vegetation zone. a Difference in mean growth per hectare per species according to 1–4 °C warming and −5 to +15% changes in growing season precipitation (ppt). Colored ribbons represent relative standard error of the mean. b Difference in mean growth per hectare for the combined species. Pie chart indicates the relative contribution of each species to baseline mean growth across the boreal zone. Values were obtained by averaging plot-level basal area growth across 15-km polygons, then averaging polygon-level growth across the boreal zone

References

    1. Wang Y, Hogg EH, Price DT, Edwards J, Williamson T. Past and projected future changes in moisture conditions in the Canadian boreal forest. For. Chron. 2014;90:678–691. doi: 10.5558/tfc2014-134. - DOI
    1. Brown PT, Caldeira K. Greater future global warming inferred from Earth’s recent energy budget. Nature. 2017;552:45. doi: 10.1038/nature24672. - DOI - PubMed
    1. Cox PM, Huntingford C, Williamson MS. Emergent constraint on equilibrium climate sensitivity from global temperature variability. Nature. 2018;553:319. doi: 10.1038/nature25450. - DOI - PubMed
    1. Barber VA, Juday GP, Finney BP. Reduced growth of Alaskan white spruce in the twentieth century from temperature-induced drought stress. Nature. 2000;405:668–673. doi: 10.1038/35015049. - DOI - PubMed
    1. Hogg, E. H., Michaelian, M., Hook, T. I. & Undershultz, M. E. Recent climatic drying leads to age-independent growth reductions of white spruce stands in western Canada. Glob. Change Biol.23, 5297–5308 (2017). - PubMed

Publication types