. 2018 Aug 10;8(1):11976.
doi: 10.1038/s41598-018-30265-4.

Rapid and reversible impairment of episodic memory by a high-fat diet in mice

Affiliations

Rapid and reversible impairment of episodic memory by a high-fat diet in mice

Fiona H McLean et al. Sci Rep. .

Abstract

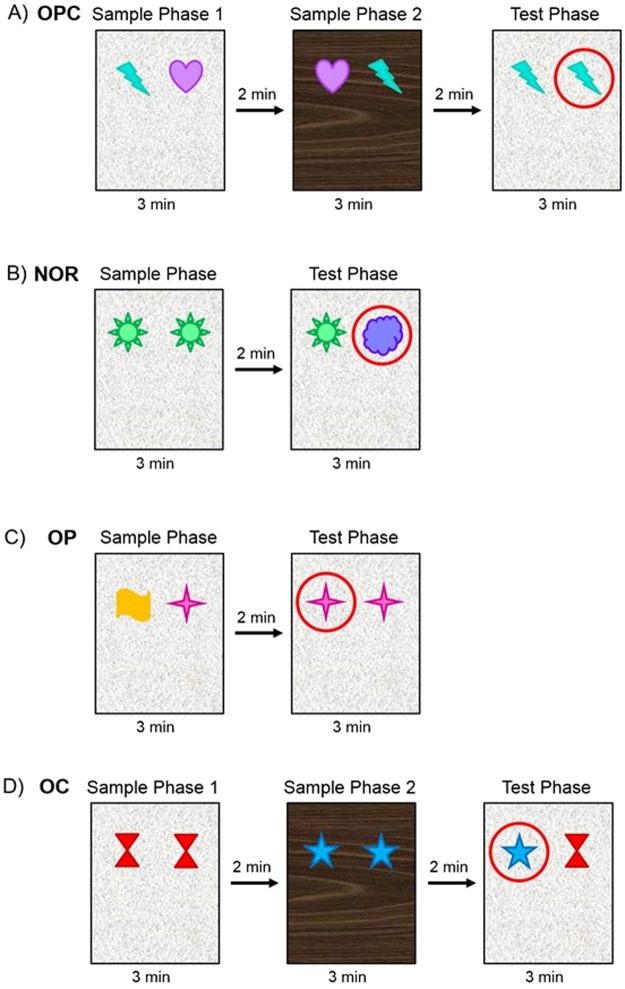
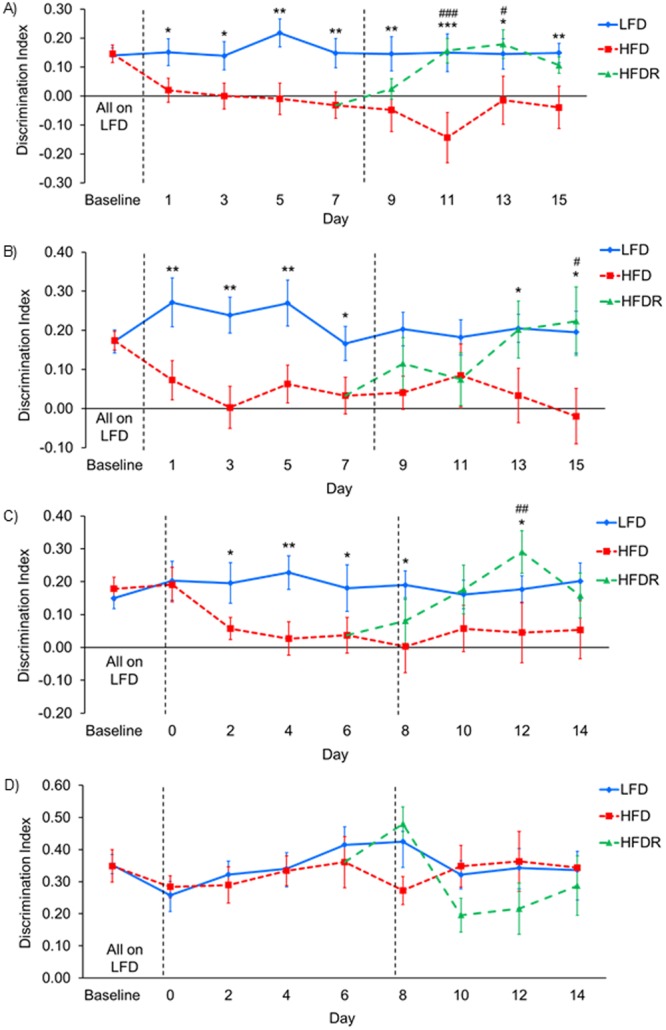
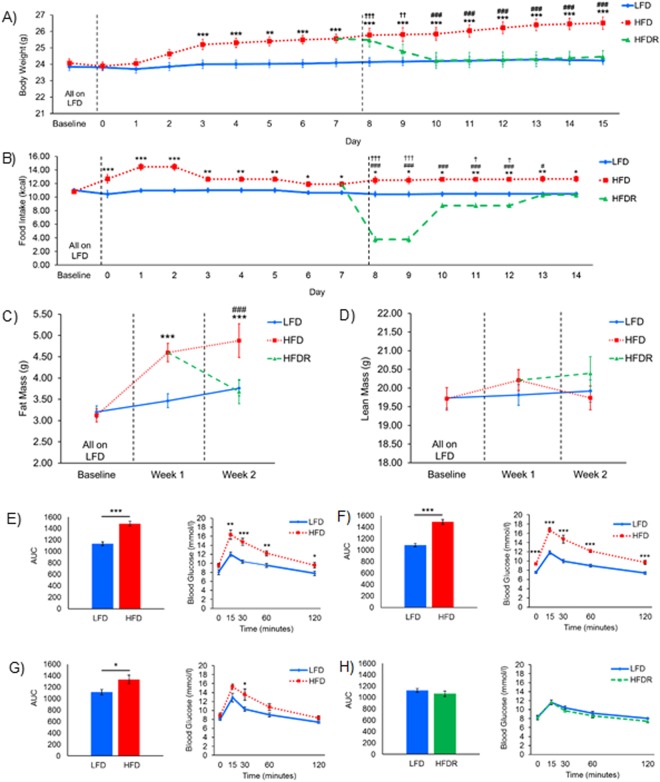
Alzheimer's disease is a leading cause of morbidity and mortality with no cure and only limited treatment available. Obesity and type 2 diabetes are positively associated with the development of premature cognitive decline and Alzheimer's disease, linking diet with these conditions. Here we demonstrate that in mice episodic memory, together with spatial and contextual associative memory, is compromised after only one day of high-fat diet. However, object memory remains intact. This shows not only a more rapid effect than previously reported but also that more complex memories are at higher risk of being compromised by a high-fat diet. In addition, we show that these memory deficits are rapidly reversed by switching mice from a high-fat diet back to a low-fat diet. These findings have important implications for the contribution of nutrition to the development of cognitive decline and Alzheimer's disease.


Conflict of interest statement

The authors declare no competing interests.

Figures

Figure 1
Figure 1
Schematic of the behavioural set-up used for different memory tasks. All tasks had phase lengths of 3 minutes with 2 minute intervals between phases. Objects which are novel or in a novel location/context for each task are circled. The four tasks are: (A) Object-Place-Context (OPC) task tests episodic memory. (B) Novel Object Recognition (NOR) task tests object memory. (C) Object-Place (OP) task tests spatial memory. (D) Object-Context (OC) task tests contextual memory.
Figure 2
Figure 2
Behavioural memory task results. (A) Object-Place-Context (OPC) task. Linear mixed model for repeated measures (LMMRM) showed an effect of diet (F(2, 125.263) = 14.821, p < 0.001), time (F(7,196.519) = 2.451, p = 0.02) and no interaction (F(10,201.976) = 0.767, p = 0.66). HFD mice performed significantly worse than LFD mice on all days tested. HFDR mice performed significantly better than HFD mice on days 11 and 13. (B) Object-Place (OP) task. LMMRM showed an effect of diet (F(2,161.124) = 10.315, p < 0.001), not time (F(7,275.612) = 0.668, p = 0.699) and no interaction (F(10, 270.500) = 1.319, p = 0.220). HFD mice performed significantly worse than LFD mice on all days tested except days 9 and 11. HFDR mice performed significantly better than HFD mice on day 15. (C) Object-Context (OC) task. LMMRM showed an effect of diet (F(2, 135.472) = 9.219, p < 0.001), not time (F(7, 209.121) = 0.312, p = 0.948) and no interaction (F(10, 229.941) = 0.427, p = 0.932). HFD mice performed significantly worse than LFD mice on all days tested except days 10 and 14. HFDR mice performed significantly better than HFD mice on day 12. (D) Novel Object Recognition (NOR) task. Linear mixed model for repeated measures showed no effect of diet (F(2,177.697) = 1.379, p = 0.255), an effect of time (F(7,257.597) = 2.253, p = 0.031) and no interaction (F(10,252.918) = 1.650, p = 0.093). All data are mean ± SEM. LFD vs. HFD *p < 0.05, **p < 0.01, ***p < 0.001; HFD vs. HFDR #p < 0.05, ##p < 0.01, ###p < 0.001. LFD group n = 24, HFD group n = 24 until day 8 where group was split into HFD n = 12 and HFDR group n = 12. Dashed lines indicate the day of diet change but are slightly offset to avoid overlying data points. Low-fat diet (LFD), high-fat diet (HFD), high-fat diet recovery (HFDR) and linear mixed model for repeated measures (LMMRM).
Figure 3
Figure 3
Body weight, composition and food intake. (A) Body weight. LMMRM showed an effect of diet (F(2,160.295) = 42.785, p < 0.001), time (F(16,669.882) = 21.131, p < 0.001) and an interaction (F(23,675.798) = 10.772, p < 0.001). HFD mice were heavier than LFD mice from day 3 onwards. HFDR mice decreased body weight following the switch to LFD, and from 2 days after were comparable with LFD mice. (B) Food intake. LMMRM showed an effect of diet (F(2,156.363) = 72.014, p < 0.001), time (F(15,423.506) = 6.676, p < 0.001) and an interaction (F(21,509.623) = 5.582, p < 0.001). HFD mice consumed more calories than LFD mice throughout. HFDR mice showed a reduction in caloric intake compared to HFD and LFD mice, which recovered by day 13 to LFD levels. (A,B) Day 1–7: LFD n = 24, HFD n = 24. Day 8–15: LFD n = 24, HFD n = 12, HFDR n = 12. (C) Fat mass. LMMRM showed an effect of diet (F(2,109.449) = 23.860, p < 0.001), time (F(2,88.941) = 62.554, p < 0.001) and an interaction (F(2,88.941) = 26.218, p < 0.001). HFD mice had higher fat mass than LFD mice in weeks 1 and 2. HFDR mice had lower fat mass than HFD mice and equivalent fat mass to LFD mice in week 2. (D) Lean mass. LMMRM showed no effect of diet (F(2,105.154) = 0.664, p = 0.517), an effect of time (F(2,87.590) = 4.174, p = 0.019) and no interaction (F(2,87.590) = 2.205, p = 0.116). (C,D) Baseline & week 1: LFD n = 23, HFD n = 23; Week 2: LFD n = 23, HFD n = 12, HFDR n = 11. (E–H) Intraperitoneal glucose tolerance tests (IPGTTs). One-way ANOVA on AUC showed a difference between LFD and HFD mice at (E) 3 days (F(1,14) = 42.519, p < 0.001), (F) 1 week (F(1,14) = 62.827, p < 0.001) and (G) 2 weeks (F(1,14) = 5.894, p = 0.029) but not (H) between LFD and HFDR at 2 weeks (F(1,14) = 0.998, p = 0.335). Blood glucose levels in LFD vs HFD mice at (E) 3 days, (F) 1 week and (G) 2 weeks and (H) LFD vs HFDR mice at 2 weeks. All groups n = 8. (A–H) Data are mean ± SEM. LFD vs HFD *p < 0.05, **p < 0.01, ***p < 0.001; LFD vs HFDR p < 0.05, ††p < 0.01, †††p < 0.001; HFD vs HFDR #p < 0.05, ##p < 0.01, ###p < 0.001. Dashed lines indicate diet switch. Diets: Low-fat (LFD), high-fat (HFD), high-fat recovery (HFDR), area under curve (AUC) and linear mixed model for repeated measures (LMMRM).

References

    1. Knopman D, et al. Atherosclerosis Risk in Communities Study I. Cardiovascular risk factors and cognitive decline in middle-aged adults. Neurology. 2001;56(1):42–8. doi: 10.1212/WNL.56.1.42. - DOI - PubMed
    1. Strachan MW, Reynolds RM, Marioni RE, Price JF. Cognitive function, dementia and type 2 diabetes mellitus in the elderly. Nature Reviews Endocrinology. 2011;7(2):108. doi: 10.1038/nrendo.2010.228. - DOI - PubMed
    1. Kanoski SE, Davidson TL. Western diet consumption and cognitive impairment: links to hippocampal dysfunction and obesity. Physiology & Behavior. 2011;103(1):59–68. doi: 10.1016/j.physbeh.2010.12.003. - DOI - PMC - PubMed
    1. Cordner ZA, Tamashiro KLK. Effects of high-fat diet exposure on learning & memory. Physiology & Behavior. 2015;152:363–71. doi: 10.1016/j.physbeh.2015.06.008. - DOI - PMC - PubMed
    1. Selkoe DJ. The molecular pathology of Alzheimer’s disease. Neuron. 1991;6(4):487–98. doi: 10.1016/0896-6273(91)90052-2. - DOI - PubMed

Publication types