Review
. 2018 Sep;47(3):485-504.
doi: 10.1016/j.ecl.2018.05.002.

The NETest: The Clinical Utility of Multigene Blood Analysis in the Diagnosis and Management of Neuroendocrine Tumors

Affiliations
Review

The NETest: The Clinical Utility of Multigene Blood Analysis in the Diagnosis and Management of Neuroendocrine Tumors

Irvin M Modlin et al. Endocrinol Metab Clin North Am. 2018 Sep.

Abstract

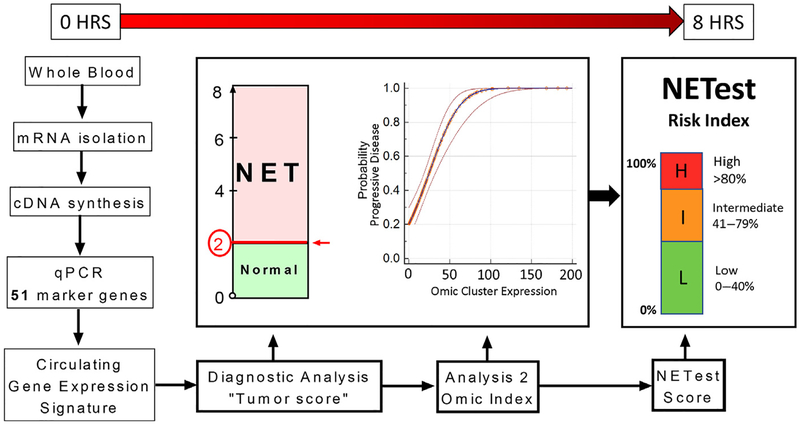
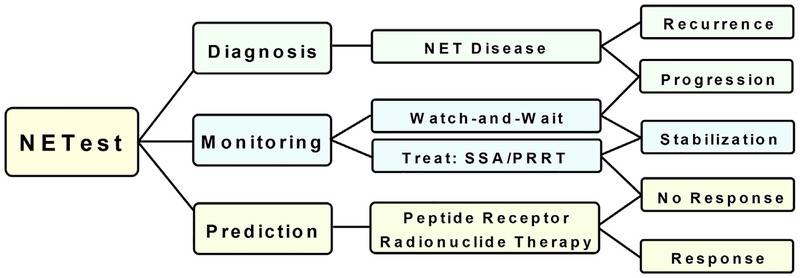
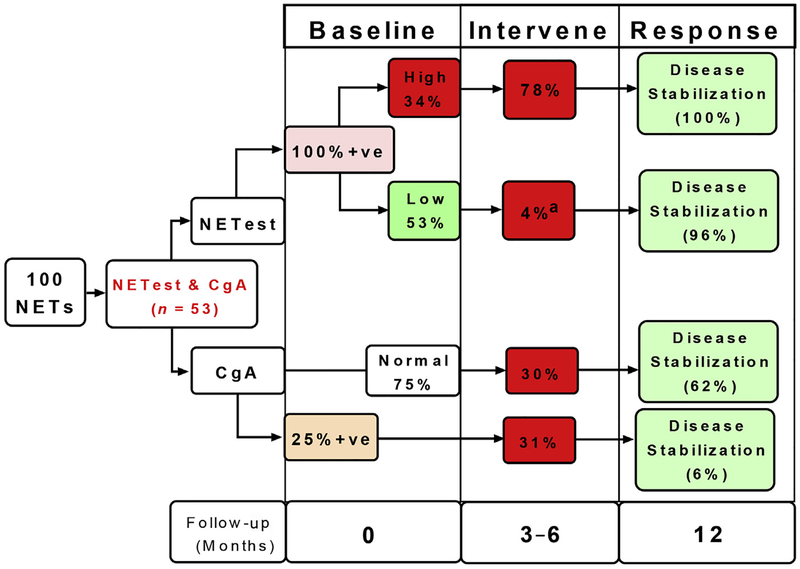
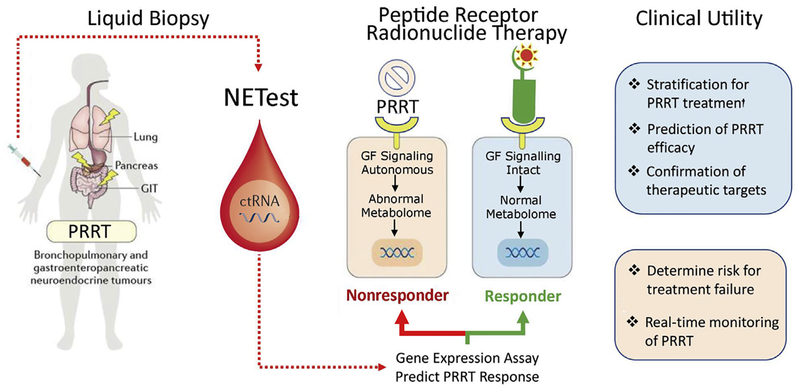
The neuroendocrine neoplasms test (NETest) is a multianalyte liquid biopsy that measures neuroendocrine tumor gene expression in blood. This unique signature precisely defines the biological activity of an individual tumor in real time. The assay meets the 3 critical requirements of an optimal biomarker: diagnostic accuracy, prognostic value, and predictive therapeutic assessment. NETest performance metrics are sensitivity and specificity and in head-to-head comparison are 4-fold to 10-fold more accurate than chromogranin A. NETest accurately identifies completeness of surgery and response to somatostatin analogs. Clinical registry data demonstrate significant clinical utility in watch/wait programs.

Keywords: Biomarker; Blood; Bronchopulomary carcinoid; Multigene blood analysis; NETest; Neuroendocrine tumors; PCR; Peptide receptor radionuclide therapy; Progression; Transcript.


Figures

Fig. 1.
Fig. 1.
Numbers of publications (PubMed) or Web focus (Google Trending) relating to “liquid biopsy”. Significant public interest was initially noted in 2004 and has escalated since 2012. Academic interest initially lagged but has subsequently escalated from 2012. There has been an exponential explosion in interest in both domains though the medical scientific community appear to be less receptive than the public.
Fig. 2.
Fig. 2.
Computational pipeline used to derive a set of marker genes, the NET Marker Panel that identifies GEP-NEN/NET disease in the blood. Step 1: gene coexpression networks inferred from 2 independent data sets (GEP-NEN-A and GEP-NEN-B) are intersected to produce the GEP-NEN network. Step 2: coexpression networks from neoplastic and normal tissue microarray data sets are combined to produce the normal and neoplastic networks. Step 3: links present in normal and neoplastic networks are subtracted from the GEP-NEN network. Step 4: up-regulated genes in both the GEP-NEN-A and GEP-NEN-B data sets (n = 21) are mapped to the consensus GEP-NEN network. Step 5: identification of consistently up-regulated genes in GEP-NEN blood transcriptome and GEP-NEN-A and GEP-NENB data sets, provided 32 putative genes. Step 6: literature curation and cancer mutation database search yielded an additional panel of 22 putative marker genes. A total of 75 marker genes was analyzed prior to delineation of the final NET marker panel. Step 7: the final NETest liquid biopsy includes 51 marker genes that were validated in 3 independent cohorts totaling 193 NETs and 172 controls. RT-PCR, reverse transcription PCR. (Modified from Modlin I, Drozdov I, Kidd M. The identification of gut neuroendocrine tumor disease by multiple synchronous transcript analysis in blood. PLoS One 2013;8:e63364; with permission.)
Fig. 3.
Fig. 3.
The multistep protocol used to provide a multianalyte gene expression panel for GEP-NETs. A 2-step protocol (mRNA isolation and cDNA synthesis) is undertaken prior to quantitative PCR gene expression. mRNA levels are normalized using house-keeping gene expression. The normalized 51-marker signature is then interrogated using 2 separate mathematical algorithmic analyses. This provides two readouts. The first generates a score that identifies whether the sample is a NET or non-NET (score 0–8). Samples scored 0 to 2 are classified as normals and levels of 3 to 8 are categorized as NETs. The second analysis evaluates expression of defined clusters of genes involved in the biologically relevant NET pathways. Omic values greater than or equal to 50 have a greater than 75% probability of identifying progressive disease. These 2 information sets are condensed to a single score, which is scaled 0% to 100% (the NETest score). Scaling is undertaken based on weighting the classification score (analysis 1), with the biological gene expression linked to disease status (analysis 2). The NETest delineates in a specific patient whether the tumor falls into a category of low risk (<40%), moderate risk (40%–79%), or high risk (≥80%) for disease activity. HRS, hours; qPCR, quantitative PCR.
Fig. 4.
Fig. 4.
Clinical utility of a multianalyte assay (NETest) for NET diagnosis and management. The NETest identifies disease status, detects disease progression, is prognostic, and can be used to predict PRRT efficacy. Diagnosis: the NETest can detect BP NET, pancreatic, and gastrointestinal tract NET with greater than or equal to 95% accuracy. In addition, it is effective in the diagnosis of PPGLs (≥95%). Management: NETest has clinical utility in 3 areas: (1) evaluate the effectiveness of a surgical procedure; this allows for a prediction/identification of disease recurrence; (2) evaluate treatment response to SSA or PRRT; and (3) predict treatment failure/disease progression; response to PRRT can be predicted using the NETest and subsequent measurement of transcript levels over time monitor treatment response.
Fig. 5.
Fig. 5.
Comparison of the accuracy of circulating NET transcript measurement (NETest) to CgA. The MAAA (multianalyte algorithm analysis) (NETest) is positive in 96% to 100% of bronchopulmonary, pancreatic, and small bowel NET. CgA in contrast is significantly less accurate. It is positive (elevated) in only approximately 30% to 60%. In pNETs, CgA is elevated in only 30% of tumors. Overall, CgA levels are normal in 40% to 70%, significantly limiting its clinical utility as a biomarker.
Fig. 6.
Fig. 6.
Relationship between NETest score and PFS in a prospective observational registry cohort. (A) Watch-and-wait cohort: a low NETest score was associated with mPFS of 12 months, and a high score was associated with an mPFS of 3 months. This difference was significant (HR 30.4; P<.0001). (B) Treatment cohort: a low score was associated with an mPFS that was not reached at 12-months, and a high score was associated with an mPFS of 5 months; this difference was significant (HR 60.2; P<.0001).
Fig. 7.
Fig. 7.
Comparative clinical utility for CgA and NETest; 100 patients were studied, of whom 53 had both a NETest and CgA. NETest was positive in all 53 samples. CgA levels were elevated in 13 (25%) and were normal in 40 (75%). High NETest scores were noted in 18 (34%) of the 53 patients. Alterations in clinical management (intervene) were made in 78%. All demonstrated disease stabilization at subsequent follow-up (12 months). Low scores were associated with a management change in 1 patient (4%). This patient progressed on everolimus. All other patients (96%) exhibited disease stabilization. CgA was associated with alterations in clinical management in approximately 30% of patients, irrespective of whether the CgA level was elevated. Disease stabilization ranged from 6% to 62% based on intervention and score. CgA levels, therefore, are unable to effectively guide disease management. a P<.0001 versus high score. F/Up, Follow-up; Mo, months; 1ve, positive.
Fig. 8.
Fig. 8.
Cartoon of tumor cell response to 177Lu-octreotate therapy. Tumors (blue) responsive to PRRT exhibit a circulating gene fingerprint that has intact, regulated growth factor signaling pathways and normal metabolic pathways. These tumors are predicted to undergo significant DNA damage and tumor apoptosis leading to regression or disease stabilization. Tumors (orange) that are autonomous of growth factor modulation and exhibit abnormal metabolome (highly metabolically active) have variable responses to PRRT. Clinical progression is identified after PRRT in the majority (85%–100%) of tumors with predicted nonresponse gene signature. Evaluating blood NET gene expression prior to PRRT facilitates the precise identification of PRRT-responsive tumors. (Modified from Kidd M, Modlin IM. Therapy: the role of liquid biopsies to manage and predict PRRT for NETs. Nat Rev Gastroenterol Hepatol 2017;14:6:331–2; with permission.)

References

    1. de Mestier L, Dromain C, d’Assignies G, et al. Evaluating digestive neuroendocrine tumor progression and therapeutic responses in the era of targeted therapies: state of the art. Endocr Relat Cancer 2014;21(3):R105–20. Print 2014. - PubMed
    1. Bergsland EK. The evolving landscape of neuroendocrine tumors. Semin Oncol 2013;40(1):4–22. - PubMed
    1. Wang H, Chen Y, Fernandez-Del Castillo C, et al. Heterogeneity in signaling pathways of gastroenteropancreatic neuroendocrine tumors: a critical look at notch signaling pathway. Mod Pathol 2012;24(10):143. - PubMed
    1. Sundin A, Rockall A. Therapeutic monitoring of gastroenteropancreatic neuroendocrine tumors: the challenges ahead. Neuroendocrinology 2012;96(4):261–71. - PubMed
    1. Kidd M, Schimmack S, Lawrence B, et al. EGFR/TGFalpha and TGFbeta/CTGF signaling in neuroendocrine neoplasia: theoretical therapeutic targets. Neuroendocrinology 2012;15:15. - PMC - PubMed