. 2019 Apr:198:63-77.
doi: 10.1016/j.biomaterials.2018.07.048. Epub 2018 Jul 30.

A three-dimensional (3D) organotypic microfluidic model for glioma stem cells - Vascular interactions

Affiliations

A three-dimensional (3D) organotypic microfluidic model for glioma stem cells - Vascular interactions

Danh Truong et al. Biomaterials. 2019 Apr.

Abstract

Glioblastoma (GBM) is one of the deadliest forms of cancer. Despite many treatment options, prognosis of GBM remains dismal with a 5-year survival rate of 4.7%. Even then, tumors often recur after treatment. Tumor recurrence is hypothesized to be driven by glioma stem cell (GSC) populations which are highly tumorigenic, invasive, and resistant to several forms of therapy. GSCs are often concentrated around the tumor vasculature, referred to as the vascular niche, which are known to provide microenvironmental cues to maintain GSC stemness, promote invasion, and resistance to therapies. In this work, we developed a 3D organotypic microfluidic platform, integrated with hydrogel-based biomaterials, to mimic the GSC vascular niche and study the influence of endothelial cells (ECs) on patient-derived GSC behavior and identify signaling cues that mediate their invasion and phenotype. The established microvascular network enhanced GSC migration within a 3D hydrogel, promoted invasive morphology as well as maintained GSC proliferation rates and phenotype (Nestin, SOX2, CD44). Notably, we compared migration behavior to in vivo mice model and found similar invasive morphology suggesting that our microfluidic system could represent a physiologically relevant in vivo microenvironment. Moreover, we confirmed that CXCL12-CXCR4 signaling is involved in promoting GSC invasion in a 3D vascular microenvironment by utilizing a CXCR4 antagonist (AMD3100), while also demonstrating the effectiveness of the microfluidic as a drug screening assay. Our model presents a potential ex vivo platform for studying the interplay of GSCs with its surrounding microenvironment as well as development of future therapeutic strategies tailored toward disrupting key molecular pathways involved in GSC regulatory mechanisms.


Figures

Fig. 1.
Fig. 1.. Schematic of GSC-EC interaction.
(A) Schematic of the vascular niche within the GBM tumor microenvironment demonstrating GSC (red) migration in response to ECs (green). (B) The 3D schematic and photograph of the microfluidic platform is showing the different regions for cell culture and migration. Blue represents the tumor region housing the GB3 and red represents the vasculature region containing the HUVECs. The green region in the middle enables GB3 migration toward the microvascular network.
Fig. 2.
Fig. 2.. Successful formation of 3D microvascular network within the microfluidic platform.
(A) Phase-contrast images of HUVECs forming microvascular network over 3 days of culture; Scale bar: 100 µm top image and 50 µm for bottom row. (B) Fluorescent dextran perfused into the media channels demonstrating open lumens within microvascular network. (C) CD-31 stain confirming the morphology of vessels within microfluidic device. Cross-sectional view (red lines) demonstrating hollow lumen of the vessels; Scale bar: 50 µm.
Fig. 3.
Fig. 3.. GB3 GSCs demonstrated stem phenotype within the 3D microfluidic device.
(A) GSCs demonstrated positive staining for Nestin and (B) negative for GFAP while (C and D) SOX2 and CD44 were positively expressed in GSCs within different medium compositions.
Fig. 4.
Fig. 4.. GSC invasion in under different medium conditions within the 3D microfluidic model.
(A) Phase-contrast images of GSC (red) invading in the presence of HUVECs in different medium conditions. Red dashed line delineates average migration boundary; Scale bar: 200µm. (B) Quantification of invasion distance for each condition (* denotes p < 0.05; Student’s T-test; n > 3 for each data set).
Fig. 5.
Fig. 5.. GSCs demonstrated elongated morphology during invasion.
(A) Phase-contrast and fluorescent images of GSC invading into the stroma exhibiting extensions from cell bodies. (B) Quantification of the extensions in each medium condition. (C) Quantification of the nuclei per chain in each medium condition. (D) Quantification of the nuclei per FOV in each medium condition. (* denotes p < 0.05; 2-way ANOVA with Sidak post-hoc test; n > 3 for each data set).
Fig. 6.
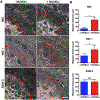
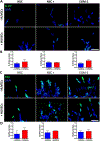
Fig. 6.. GSC proliferated within the 3D microfluidic model.
(A) Immunofluorescence staining of Ki-67 proliferative marker; Scale bar: 50 µm. (B) Quantification of Ki-67/Nuclei ratio of each medium condition. (C) Immunofluorescence staining of EdU incorporation into nuclei; Scale bar: 50 µm. (D) Quantification of EdU/Nuclei ratio of each medium condition.
Fig. 7.
Fig. 7.. GSC invasion in microfluidic and PDX models.
(A) i: GSCs (red) shown migrating toward vasculature (blue, Lectin) within the in vivo model; Scale bar: 50 µm. ii: 3D view of tissue-slices of the in vivo model demonstrating GB3 migrating along vessel. Iii: surface rendering of migrating GSCs showing the cells establishing contact with the vasculature. (B) i: Immunofluorescence staining of invading GSCs (GB3, red) near vasculature (CD-31, green) in microfluidic model. The white dashed line demarcates the border between the stroma and the vascular regions. ii: Surface rendering with multiple views of migrating GSCs (red) within the microfluidic model; Scale bar: 40 µm. (C) Comparison of chain-like migration between the two models; Scale bar: 25 µm. (D) Comparison of proliferating GSC (green, Ki-67) near vessel in both models; Scale bar: 25 µm.
Fig. 8.
Fig. 8.. CXCL12-CXCR4 signaling in GSC-EC interaction.
(A) Immunofluorescence imaging of pCXCR4 in presence of microvascular network. White arrow denotes absence and presence of nuclear localization in mono- and co-culture respectively; Scale bar: 20 µm. (B) Phase-contrast image of GSC (red) invading in presence of HUVECs in different concentrations of AMD3100. Red dashed line delineates average migration boundary; Scale bar: 100 µm. (C) Quantification of invasion distance for each condition (* denotes a significantly different group for p < 0.05; # denotes a significant difference between 1 µM and 100 µM for p < 0.05; 2-way ANOVA with Sidak post-test; n > 3 for each data set).

References

    1. Omuro A, DeAngelis LM, Glioblastoma and other malignant gliomas: a clinical review, JAMA 310(17) (2013) 1842–50. - PubMed
    1. Bao S, Wu Q, McLendon RE, Hao Y, Shi Q, Hjelmeland AB, Dewhirst MW, Bigner DD, Rich JN, Glioma stem cells promote radioresistance by preferential activation of the DNA damage response, Nature 444(7120) (2006) 756–60. - PubMed
    1. Lathia JD, Gallagher J, Myers JT, Li M, Vasanji A, McLendon RE, Hjelmeland AB, Huang AY, Rich JN, Direct in vivo evidence for tumor propagation by glioblastoma cancer stem cells, PLoS One 6(9) (2011) e24807. - PMC - PubMed
    1. Lathia JD, Mack SC, Mulkearns-Hubert EE, Valentim CL, Rich JN, Cancer stem cells in glioblastoma, Genes Dev 29(12) (2015) 1203–17. - PMC - PubMed
    1. Sundar SJ, Hsieh JK, Manjila S, Lathia JD, Sloan A, The role of cancer stem cells in glioblastoma, Neurosurg Focus 37(6) (2014) E6. - PubMed

Publication types