Review
. 2019 Nov 27;20(6):2028-2043.
doi: 10.1093/bib/bby066.

Recent advances and prospects of computational methods for metabolite identification: a review with emphasis on machine learning approaches

Affiliations
Review

Recent advances and prospects of computational methods for metabolite identification: a review with emphasis on machine learning approaches

Dai Hai Nguyen et al. Brief Bioinform. .

Abstract

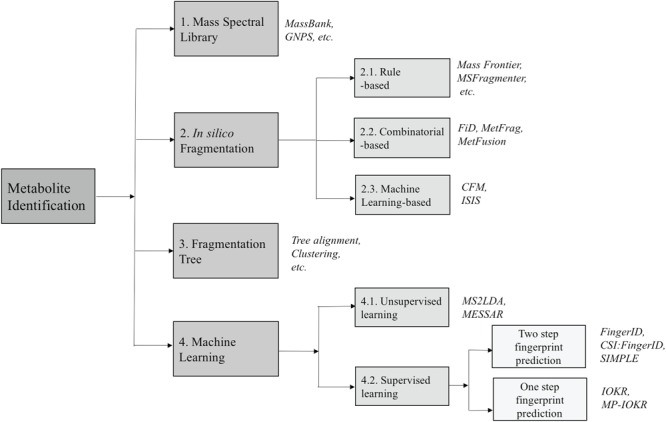
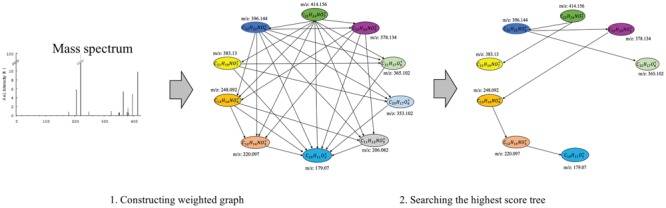
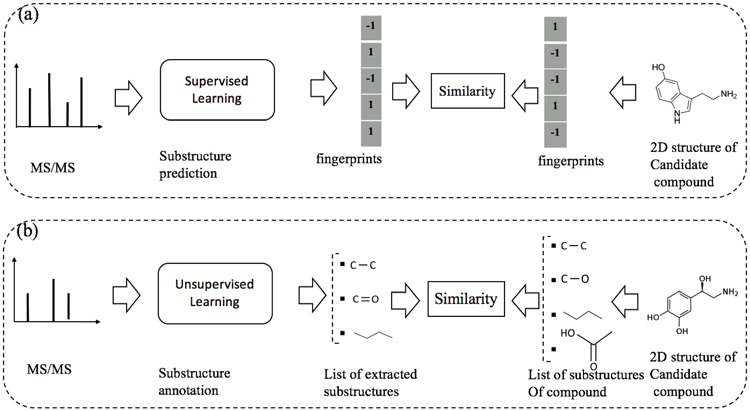
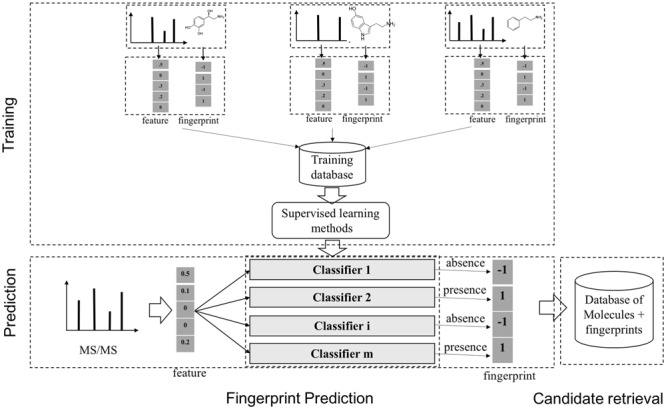
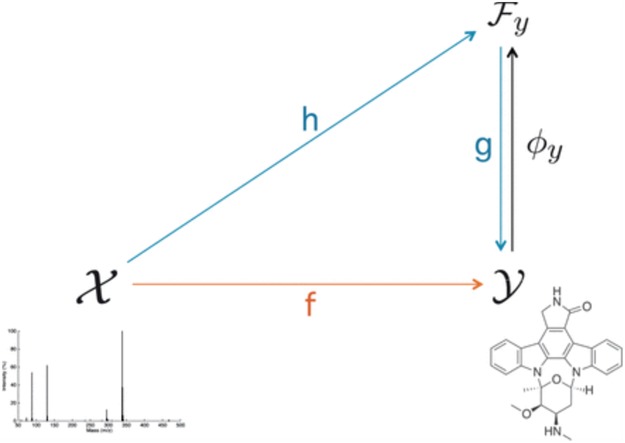
Metabolomics involves studies of a great number of metabolites, which are small molecules present in biological systems. They play a lot of important functions such as energy transport, signaling, building block of cells and inhibition/catalysis. Understanding biochemical characteristics of the metabolites is an essential and significant part of metabolomics to enlarge the knowledge of biological systems. It is also the key to the development of many applications and areas such as biotechnology, biomedicine or pharmaceuticals. However, the identification of the metabolites remains a challenging task in metabolomics with a huge number of potentially interesting but unknown metabolites. The standard method for identifying metabolites is based on the mass spectrometry (MS) preceded by a separation technique. Over many decades, many techniques with different approaches have been proposed for MS-based metabolite identification task, which can be divided into the following four groups: mass spectra database, in silico fragmentation, fragmentation tree and machine learning. In this review paper, we thoroughly survey currently available tools for metabolite identification with the focus on in silico fragmentation, and machine learning-based approaches. We also give an intensive discussion on advanced machine learning methods, which can lead to further improvement on this task.

Keywords: machine learning; mass spectrometry; substructure annotation; substructure prediction.


Figures

Figure 1
Figure 1
Example MS spectrum from the public Human Metabolome Database for 1-Methylhistidine (HMBD00001) [66], with its corresponding chemical structure (top left) and peak list (top right).
Figure 2
Figure 2
Main components of a mass spectrometer: ionization source, mass analyzer and detector.
Figure 3
Figure 3
A mass spectral tree with nodes corresponding to individual mass spectra with different levels. Mass spectral trees are characterized by depth (formula image level) and breadth (the number of product ions chosen for the subsequent fragmentation). The figure is adapted from [61].
Figure 4
Figure 4
The overview of approaches for metabolite identification. The numbers show the corresponding (sub)sections for each category.
Figure 5
Figure 5
An illustration of generating all connected subgraphs of the precursor graph.
Figure 6
Figure 6
An illustration of MAGMA to recursively rank structure candidates with multiple levels.
Figure 7
Figure 7
The flowchart of MetFusion: MassBank and MetFrag process the query spectrum and return two individually ranked list of compound candidates. The lists are then combined into a single integrated list of re-ranked candidates by calculating the similarity between candidate structures.
Figure 8
Figure 8
An illustration to clarify the difference between ML-based methods for learning and predicting in silico spectra from 2D structures of compounds (a) and ML based methods for learning and predicting substructures or chemical properties from MS/MS spectra (b). The numbers indicate the (sub)sections for each category.
Figure 9
Figure 9
Noscapine and the corresponding hypothetical fragmentation tree computed by the method introduced in [46].
Figure 10
Figure 10
An illustration to clarify the difference between supervised and unsupervised learning for metabolite identification: (a) substructure prediction using supervised learning to map a given MS/MS spectrum to an intermediate representation (e.g. fingerprints), which is subsequently used to retrieve candidate metabolites in the database. (b) substructure annotation using unsupervised learning to extract biochemically relevant substructures with certain confidence from the given spectrum. Then, the similarity between the MS/MS spectrum and a chemical structure of a metabolite is estimated according to their common substructures. Note that the output of supervised learning (e.g. fingerprints) may indicate the presence/absence of all ‘predefined’ substructures whereas that of unsupervised learning may be a list of substructures frequently occurring in the database.
Figure 11
Figure 11
A general scheme to identify unknown metabolites based on the molecular fingerprint vectors. There are two main stages, which are as follows: (1) learning a mapping from a molecule to the corresponding binary molecular fingerprint vector by classification methods, given a set of MS/MS spectra and fingerprints; (2) using the predicted fingerprints to retrieve candidate molecules from the databases of known metabolites.
Figure 12
Figure 12
The overview of IOKR. The figure is adapted from [6].
Figure 13
Figure 13
Simplified graphical representation of LDA.
Figure 14
Figure 14
The correspondence between LDA for text and MS2LDA for mass spectra: LDA finds topics based on the co-occurrence of words while MS2LDA finds substructures based on the co-occurrence of mass fragments and neutral losses. This figure is adapted from [60].
Figure 15
Figure 15
Graphical representation of Markov random field regularized LDA; if two words are correlated according to the external knowledge, an undirected edge between their topic labels is created. Finally, a graph in which nodes are latent topic labels and edges connect topic labels of semantically related words. In this example, the graph contains five nodes formula image, formula image, formula image, formula image, formula image and four edges (formula image, formula image), (formula image, formula image), (formula image, formula image) and (formula image, formula image).

References

    1. Allen F, Greiner R, Wishart D. Competitive fragmentation modeling of ESI-MS/MS spectra for putative metabolite identification. Metabolomics 2015;11(1):98–110.
    1. Andrzejewski D, Zhu X, Craven M.. Incorporating domain knowledge into topic modeling via dirichlet forest priors. In: Proceedings of the 26th Annual International Conference on Machine Learning, 2009. pp. 25–32. Montreal, QC, Canada: ACM. - PMC - PubMed
    1. Bien J, Taylor J, Tibshirani R. A lasso for hierarchical interactions. Ann Statist 2013;41(3):1111. - PMC - PubMed
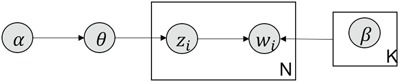
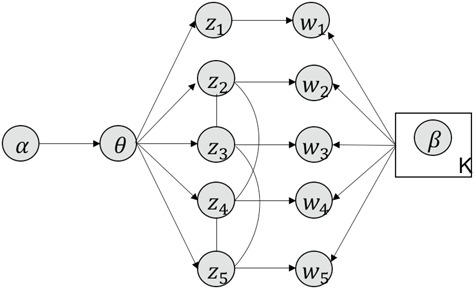
    1. Blei DM, Ng AY, Jordan MI. Latent dirichlet allocation. J Mach Learn Res 2003;3(Jan):993–1022.
    1. Böcker S, Rasche F. Towards de novo identification of metabolites by analyzing tandem mass spectra. Bioinformatics 2008;24(16):i49–55. - PubMed

Publication types