

Live-Birth Bias and Observed Associations Between Air Pollution and Autism
- PMID: 30099488
- PMCID: PMC6211245
- DOI: 10.1093/aje/kwy172
Live-Birth Bias and Observed Associations Between Air Pollution and Autism
Abstract
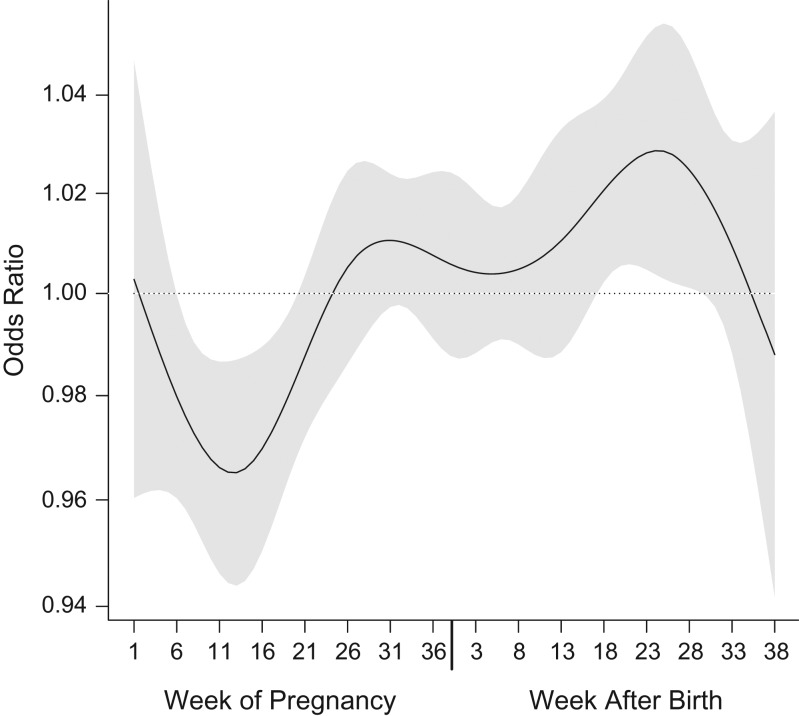
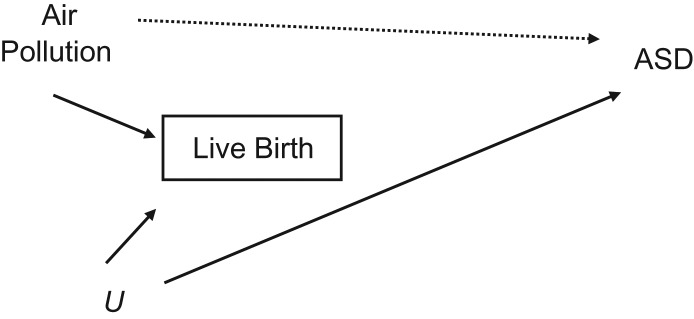
A recent analysis found that exposure to air pollution during specific weeks of pregnancy was negatively associated with risk of autism spectrum disorder (ASD) when mutually adjusted for postnatal air-pollution exposure. In this commentary, we describe 2 possible selection-bias processes that might lead to such results, both related to live-birth bias (i.e., the inevitable restriction of the analyzed sample to live births). The first mechanism is described using a directed acyclic graph and relates to the chance of live birth being a common consequence of both exposure to air pollution and another risk factor of ASD. The second mechanism involves preferential depletion of fetuses susceptible to ASD in the higher air-pollution exposure group. We further discuss the assumptions underlying these processes and their causal structures, their plausibility, and other studies where similar phenomena might have occurred.
Figures
References
-
- Yang C, Zhao W, Deng K, et al. The association between air pollutants and autism spectrum disorders. Environ Sci Pollut Res Int. 2017;24(19):15949–15958. - PubMed
-
- Flores-Pajot MC, Ofner M, Do MT, et al. Childhood autism spectrum disorders and exposure to nitrogen dioxide, and particulate matter air pollution: a review and meta-analysis. Environ Res. 2016;151:763–776. - PubMed
Publication types
MeSH terms
Substances
Grants and funding
LinkOut - more resources
Full Text Sources
Other Literature Sources
Medical
