

Preserved anabolic threshold and capacity as estimated by a novel stable tracer approach suggests no anabolic resistance or increased requirements in weight stable COPD patients
- PMID: 30100106
- PMCID: PMC6355392
- DOI: 10.1016/j.clnu.2018.07.018
Preserved anabolic threshold and capacity as estimated by a novel stable tracer approach suggests no anabolic resistance or increased requirements in weight stable COPD patients
Abstract
Background & aims: Assessing the ability to respond anabolic to dietary protein intake during illness provides important insight in the capacity of lean body mass maintenance. We applied a newly developed stable tracer approach to assess in one session in patients with chronic obstructive pulmonary disease (COPD) and healthy older adults both the minimal amount of protein intake to obtain protein anabolism (anabolic threshold) and the efficiency of dietary protein to promote protein anabolism (anabolic capacity).
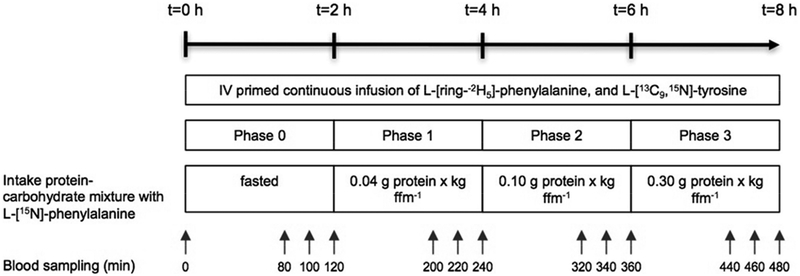
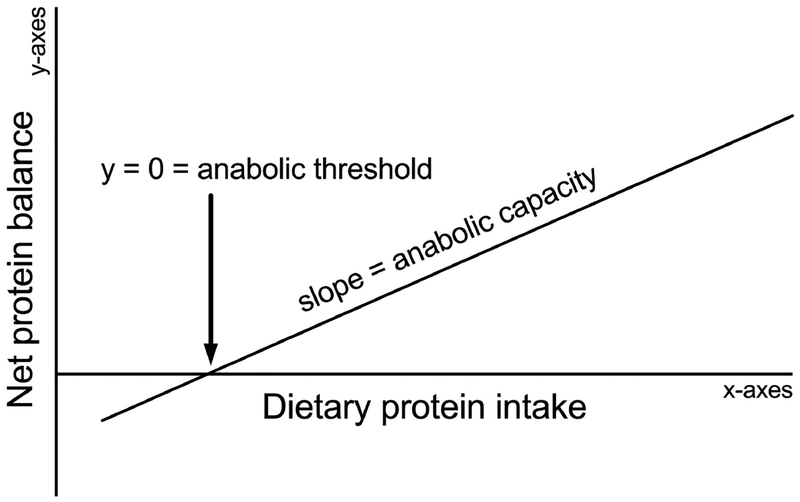
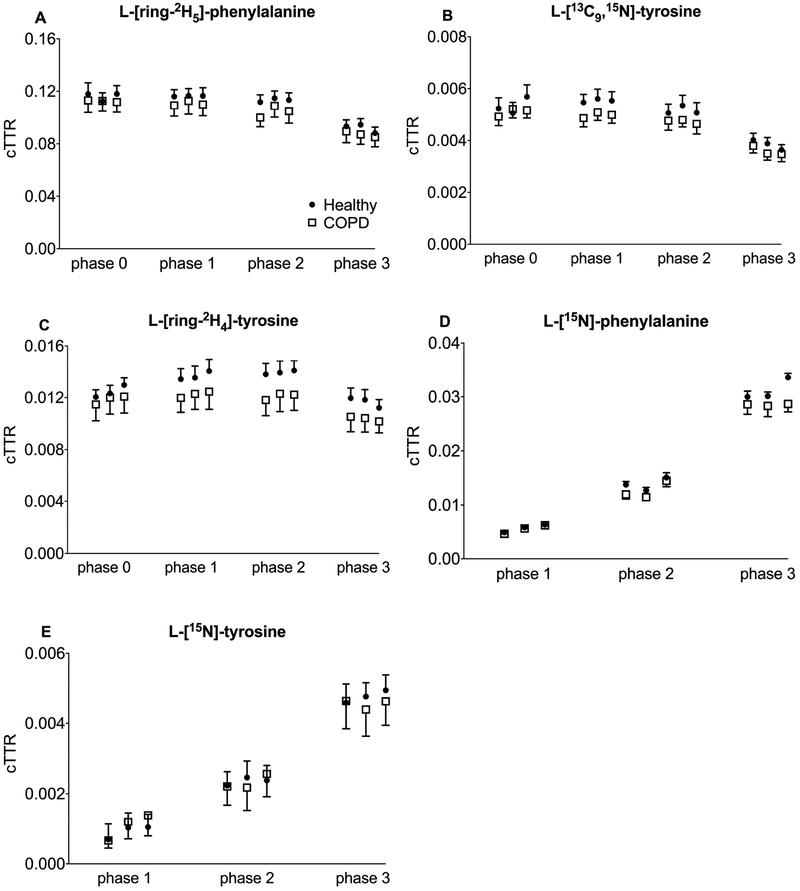
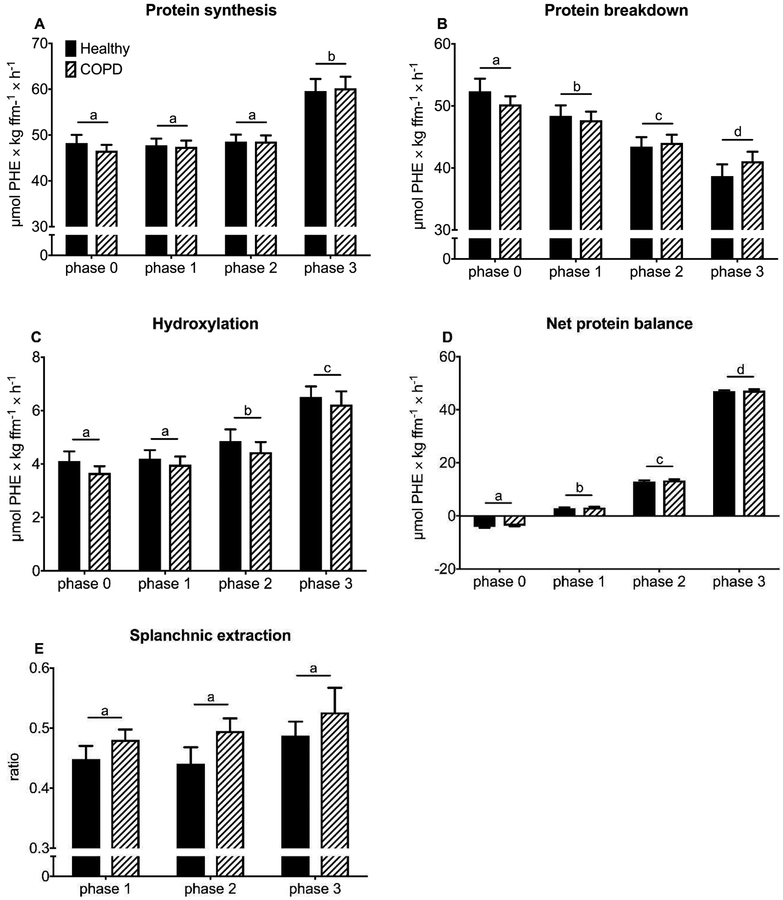
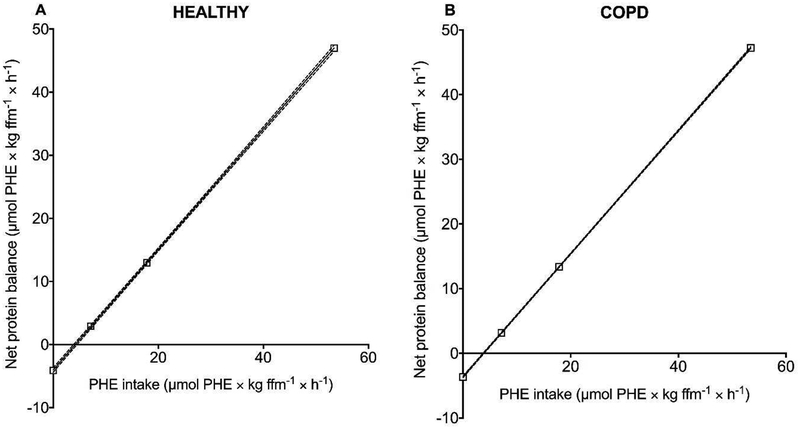
Methods: We studied 12 clinically and weight stable patients with moderate to very severe COPD (mean ± SE forced expiratory volume in 1 s: 36 ± 3% of predicted) and 10 healthy age-matched older adults. At 2-h intervals and in consecutive order, all participants consumed a mixture of 0.0, 0.04, 0.10 and 0.30 g hydrolyzed casein protein×kg ffm-1×2 h-1 and carbohydrates (2:1). We assessed whole body protein synthesis (PS), breakdown (PB), net PS (PS-PB) and net protein balance (phenylalanine (PHE) intake - PHE to tyrosine (TYR) hydroxylation) by IV primed and continuous infusion of L-[ring-2H5]PHE and L-[13C9,15N]-TYR. Anabolic threshold (net protein balance = 0) and capacity (slope) were determined on an individual basis from the assumed linear relationship between protein intake and net protein balance.
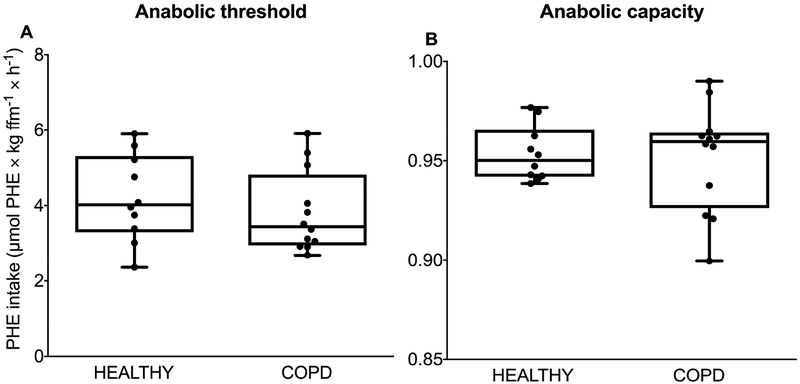
Results: We confirmed a linear relationship between protein intake and net protein balance for all participants (R2 range: 0.9988-1.0, p ≤ 0.0006). On average, the anabolic threshold and anabolic capacity were comparable between the groups (anabolic threshold COPD vs. healthy: 3.82 ± 0.31 vs. 4.20 ± 0.36 μmol PHE × kg ffm-1 × hr-1; anabolic capacity COPD vs. healthy: 0.952 ± 0.007 and 0.954 ± 0.004). At protein intake around the anabolic threshold (0.04 and 0.10 g protein×kg ffm-1×2 h-1), the increase in net PS resulted mainly from PB reduction (p < 0.0001) whereas at a higher protein intake (0.30 g protein×kg ffm-1×2 h-1) PS was also stimulated (p < 0.0001).
Conclusions: The preserved anabolic threshold and capacity in clinically and weight stable COPD patients suggests no disease related anabolic resistance and/or increased protein requirements.
Trial registry: ClinicalTrials.gov; No. NCT01734473; URL: www.clinicaltrials.gov.
Keywords: COPD; Casein; Protein anabolism; Protein requirements; Protein threshold.
Copyright © 2018 Elsevier Ltd and European Society for Clinical Nutrition and Metabolism. All rights reserved.
Figures
Similar articles
-
A critical evaluation of the anabolic response after bolus or continuous feeding in COPD and healthy older adults.Clin Sci (Lond). 2018 Jan 2;132(1):17-31. doi: 10.1042/CS20171068. Print 2018 Jan 16. Clin Sci (Lond). 2018. PMID: 29187513
-
Whole body protein anabolism in COPD patients and healthy older adults is not enhanced by adding either carbohydrates or leucine to a serving of protein.Clin Nutr. 2019 Aug;38(4):1684-1691. doi: 10.1016/j.clnu.2018.08.006. Epub 2018 Aug 16. Clin Nutr. 2019. PMID: 30150004 Free PMC article. Clinical Trial.
-
Effectiveness of essential amino acid supplementation in stimulating whole body net protein anabolism is comparable between COPD patients and healthy older adults.Metabolism. 2017 Apr;69:120-129. doi: 10.1016/j.metabol.2016.12.010. Epub 2016 Dec 20. Metabolism. 2017. PMID: 28285641 Free PMC article. Clinical Trial.
-
Role of specific dietary amino acids in clinical conditions.Br J Nutr. 2012 Aug;108 Suppl 2(0 2):S139-48. doi: 10.1017/S0007114512002358. Br J Nutr. 2012. PMID: 23107525 Free PMC article. Review.
-
International society of sports nutrition position stand: nutrient timing.J Int Soc Sports Nutr. 2017 Aug 29;14:33. doi: 10.1186/s12970-017-0189-4. eCollection 2017. J Int Soc Sports Nutr. 2017. PMID: 28919842 Free PMC article. Review.
Cited by
-
Intestinal function is impaired in patients with Chronic Obstructive Pulmonary Disease.Clin Nutr. 2021 Apr;40(4):2270-2277. doi: 10.1016/j.clnu.2020.10.010. Epub 2020 Oct 10. Clin Nutr. 2021. PMID: 33873268 Free PMC article.
-
Activated whole-body arginine pathway in high-active mice.PLoS One. 2020 Jun 26;15(6):e0235095. doi: 10.1371/journal.pone.0235095. eCollection 2020. PLoS One. 2020. PMID: 32589680 Free PMC article.
-
Efficacy of interventions to alter measures of fat-free mass in people with COPD: a systematic review and meta-analysis.ERJ Open Res. 2023 Jul 31;9(4):00102-2023. doi: 10.1183/23120541.00102-2023. eCollection 2023 Jul. ERJ Open Res. 2023. PMID: 37529637 Free PMC article. Review.
-
Practical Guidelines by the Andalusian Group for Nutrition Reflection and Investigation (GARIN) on Nutritional Management of Patients with Chronic Obstructive Pulmonary Disease: A Review.Nutrients. 2024 Sep 14;16(18):3105. doi: 10.3390/nu16183105. Nutrients. 2024. PMID: 39339705 Free PMC article.
-
Advances in nutritional metabolic therapy to impede the progression of critical illness.Front Nutr. 2024 Jul 5;11:1416910. doi: 10.3389/fnut.2024.1416910. eCollection 2024. Front Nutr. 2024. PMID: 39036495 Free PMC article. Review.
References
-
- Biolo G, Antonione R, Barazzoni R, Zanetti M, Guarnieri G. Mechanisms of altered protein turnover in chronic diseases: a review of human kinetic studies. Curr Opin Clin Nutr Metab Care. 2003;6(1):55–63. - PubMed
-
- Argiles JM, Campos N, Lopez-Pedrosa JM, Rueda R, Rodriguez-Manas L. Skeletal Muscle Regulates Metabolism via Interorgan Crosstalk: Roles in Health and Disease. Journal of the American Medical Directors Association. 2016;17(9):789–96. - PubMed
-
- Campbell WW, Crim MC, Dallal GE, Young VR, Evans WJ. Increased protein requirements in elderly people: new data and retrospective reassessments. Am J Clin Nutr. 1994;60(4):501–9. - PubMed
-
- Volpi E, Mittendorfer B, Wolf SE, Wolfe RR. Oral amino acids stimulate muscle protein anabolism in the elderly despite higher first-pass splanchnic extraction. The American journal of physiology. 1999;277(3 Pt 1):E513–20. - PubMed
Publication types
MeSH terms
Substances
Associated data
Grants and funding
LinkOut - more resources
Full Text Sources
Other Literature Sources
Medical
