. 2018 Sep 6;23(3):382-395.e5.
doi: 10.1016/j.stem.2018.07.001. Epub 2018 Aug 9.

Tbx6 Induces Nascent Mesoderm from Pluripotent Stem Cells and Temporally Controls Cardiac versus Somite Lineage Diversification

Affiliations

Tbx6 Induces Nascent Mesoderm from Pluripotent Stem Cells and Temporally Controls Cardiac versus Somite Lineage Diversification

Taketaro Sadahiro et al. Cell Stem Cell. .

Abstract

The mesoderm arises from pluripotent epiblasts and differentiates into multiple lineages; however, the underlying molecular mechanisms are unclear. Tbx6 is enriched in the paraxial mesoderm and is implicated in somite formation, but its function in other mesoderms remains elusive. Here, using direct reprogramming-based screening, single-cell RNA-seq in mouse embryos, and directed cardiac differentiation in pluripotent stem cells (PSCs), we demonstrated that Tbx6 induces nascent mesoderm from PSCs and determines cardiovascular and somite lineage specification via its temporal expression. Tbx6 knockout in mouse PSCs using CRISPR/Cas9 technology inhibited mesoderm and cardiovascular differentiation, whereas transient Tbx6 expression induced mesoderm and cardiovascular specification from mouse and human PSCs via direct upregulation of Mesp1, repression of Sox2, and activation of BMP/Nodal/Wnt signaling. Notably, prolonged Tbx6 expression suppressed cardiac differentiation and induced somite lineages, including skeletal muscle and chondrocytes. Thus, Tbx6 is critical for mesoderm induction and subsequent lineage diversification.

Keywords: Tbx6; cardiovascular; chondrocyte; mesoderm; pluripotent stem cell; skeletal muscle.


Conflict of interest statement

DECLARATION OF INTERESTS

T.S., M. Isomi, N.G., and M. Ieda are inventors on patent applications describing the Tbx6-induced reprogramming and differentiation into cardiac progenitors and cardiomyocytes.

Figures

Figure 1.
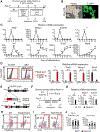
Figure 1.. Tbx6 Induced and Maintained a Mesoderm Program in Mouse Fibroblasts
(A and B) qRT-PCR for Mesp1 expression after transduction of individual (A) or combinatorial (B) factors after 1 week (n = 3, independent experiments). Data were normalized to the values in MEFs. (C) Immunocytochemistry for Mesp1Cre-GFP and DAPI with quantification of the numbers of Mesp1Cre-GFP+ colonies (n = 3, independent experiments). Tbx6 induced Mesp1Cre-GFP expression after 2 weeks of transduction. (D) Immunocytochemistry and quantification of the numbers of T+ colonies (n = 3, independent experiments). Immunocytochemistry demonstrated that T protein was expressed in Tbx6transduced mouse embryonic fibroblast nuclei after 4 weeks. (F) FACS analyses showed that Tbx6transduced cells expressed cell-surface markers Flk1 and PDGFRα (n = 3, independent experiments). Time course of mRNA expression in MEFs transduced with Tbx6, as determined by qRT-PCR. Gene expression for mesoderm (Mesp1, T, Flk1), CPCs (Isl1, Nkx2.5, Gata4), CMs (Tnnt2, Myh6), SMCs (Myh11), ECs (Pecam1), and skeletal muscle (Pax3, Pax7, Myod1, Myf5) genes were determined. Tbx6-transduced cells expressed mesoderm genes, but not those associated with cardiovascular differentiation and skeletal muscle genes. Data were normalized to the values on day 0. All data are presented as mean ± SD. **p < 0.01; *p < 0.05 versus MEFs (A and B), control (C–E), or day 0 (F). Scale bars represent 100 μm.
Figure 2.
Figure 2.. Single-cell RNA-seq Revealed the Transcriptional Profile in Tbx6+ Nascent Mesoderm in Mouse Embryos
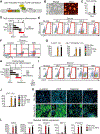
(A) Single-cell RNA-seq in E7.0–7.75 mouse embryos. FACS was used to sort single cells as Flk1+ mesoderm cells and CD41+ cells. t-SNE for 682 single cells was colored by assigned groups with varying contributions from different embryonic stages. The expression of key marker genes assigned identities to each group (left). Points were colored red depending on the expression of Tbx6 (right). (B) t-SNE for 682 cells from E7.0–7.75 mouse embryos. Each point was colored according to the expression of each gene. Single cells from mouse embryos acquired at E7.0 (138 cells, 3 embryos), E7.5 (259 cells, 12 embryos), and E7.75 (307 cells, 11 embryos) were analyzed. See also Figure S1.
Figure 3.
Figure 3.. Tbx6 Was Transiently Expressed in Mesoderm Prior to CPC and CM Differentiation in Mouse ESCs
(A) Schematic representation of the directed cardiac differentiation protocol in T-GFP mouse ESCs. (B) GFP was induced in the T-GFP embryoid bodies (EBs) after 4 days of differentiation. (C) Time course of mRNA expression during ESC differentiation determined by qRT-PCR. Data were normalized to the values on day 0. (D) Relative mRNA expression of mesoderm genes (Tbx6, T, Mesp1) and Sox2 in the FACS T-GFP+ cells and T-GFP cells after 4 days of differentiation (n = 3, independent experiments). Data were normalized to the values in T-GFP cells. (E) Generation of the Tbx6 KO mouse ESCs using the CRISPR/Cas9 system. See also Figure S1 in detail. (F) WT or Tbx6 KO mouse ESCs were differentiated into mesoderm and CMs using a directed cardiac differentiation protocol. (G) Relative mRNA expression was determined by qRT-PCR in day 4 EBs (n = 3, independent experiments). Data were normalized to the values obtained in WT ESCs. (H–J) FACS analysis for Flk1/PDGFRα and cTnT expression in the WT or clone #1 Tbx6 KO ESCs after 4 (H) or 14 days (I) of differentiation. Quantitative data are from WT and Tbx6 KO ESCs (clones #1–3) are shown in (J) (n = 3, independent experiments). All data are presented as the mean ± SD. **p < 0.01; *p < 0.05 versus day 0 (C), T-GFP cells (D), or WT ESCs (G and J). Scale bars represent 100 μm. See also Figures S2 and S3.
Figure 4.
Figure 4.. Transient Tbx6 Expression Induced Mesoderm and Cardiovascular Lineages in Mouse ESCs
(A) Schematic representation of the lentiviral construct for Dox-inducible Tbx6 expression. (B) Clonal expansion of the iTbx6 T-GFP mouse ESCs was confirmed by hKO expression. (C) The mRNA expression of Tbx6 in iTbx6 T-GFP mESCs with or without Dox administration was determined by qRT-PCR (n = 3, independent experiments). Data were normalized to the values in No Dox. (D) Scheme depicting the protocol used to evaluate the effects of Tbx6 expression on mesoderm induction. ABV indicates Activin A, BMP4, and VEGF. (E–G) FACS profiles for the expression of mesoderm markers in EBs on day 4 (E and F). Quantitative data are shown in (G). See also Figure S4C. (H) The protocol used to evaluate the effects of the duration of Tbx6 expression on cardiac differentiation. (I and J) FACS analyses for the expression of cTnT on day 14 (I). Quantitative data are shown in (J). See also Figure S4C. (K) iTbx6 T-GFP mESCs were differentiated into CMs, SMCs, and ECs with Dox administration for 3 days. Representative images are shown. (L) The mRNA expression for CM, SMC, and EC genes in iTbx6 T-GFP mESCs with (red, Dox on D0–3) or without Dox (white, No Dox) in the absence of cytokines (n = 3, independent experiments). ABV (black) is cytokine-based cardiac differentiation. Data were normalized to the values in No Dox. All data are presented as the mean ± SD. **p < 0.01; *p < 0.05 versus No Dox. Scale bars represent 100 μm. See also Figure S4.
Figure 5.
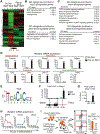
Figure 5.. Tbx6 Expression Promoted Mesoderm and Endoderm Programs and Inhibited Neuroectoderm Genes in Mouse ESCs
(A) Hierarchical clustering analysis of iTbx6 T-GFP EBs with or without Dox on days 2 and 4 (n = 2). Dox was added for the first 3 days. (B and C) GO term analyses for the upregulated and downregulated genes in iTbx6 T-GFP EBs on day 2 (B) or 4 (C) of Dox addition. (D) Relative mRNA expression on day 4 in iTbx6 T-GFP EBs with or without Dox addition was determined by qRT-PCR (n = 3, independent experiments). Data were normalized to the values of No Dox. (E) Consensus T-box binding site sequences generated by MEME (http://memesuite.org/). (F) ChIP-qPCR analyses in iTbx6 T-GFP EBs with Dox addition on day 4 using antibodies specific for FLAG (Tbx6) or IgG (control) (n = 3). Illustration of the genomic region surrounding Mesp1. Translated regions are depicted in thick black boxes, untranslated exons are shown in thin black boxes, and introns are shown by black lines. Conserved T-box binding sites are indicated as red lines, and the relative positions of PCR fragments for ChIP-qPCR are represented by black lines. (G) ChIP-qPCR analysis of iTbx6 T-GFP EBs treated with Dox on day 4 using antibodies specific for RNA polymerase II (PolII) or IgG (control) (n = 3). The primers were generated near the transcriptional start site (TSS) of Mesp1. (H) Time course of mRNA expression for Bmp4, Nodal, and Wnt3 during the differentiation of ESCs after 12, 24, 48, and 96 hr of Dox treatment, determined by qRT-PCR. Bmp4 was rapidly and strongly upregulated after only 12 hr of Dox administration. (I) Schematic representation of chimeric EB experiments. The iTbx6 T-GFP ESCs (inducer) and T-GFP ESCs (responder) were mixed and cultured for 4 days with Dox addition from days 0–3 in the absence of cytokines before FACS. FACS analyses for Flk1 and PDGFRα expression in day 4 EBs are shown (right). All data are presented as mean ± SD. **p < 0.01; *p < 0.05 versus No Dox (D), IgG (F and G), 0 hr (H), or responder (I). See also Figure S5
Figure 6.
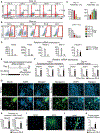
Figure 6.. Continuous Tbx6 Expression Inhibited Cardiac Differentiation and Induced Paraxial Mesoderm and Skeletal Myocyte Lineages
(A–C) FACS profiles for the expression of mesoderm markers Flk1 and PDGFRα in iTbx6 T-GFP mouse EBs at the indicated days (A). The expression of cTnT was analyzed by FACS on day 14 (B). Dox addition was started from day 0 and continued to day 7. Quantitative data are shown in (C) (n = 3, independent experiments). See also Figure 4. (D) The mRNA expression for CM, SMC, and EC genes in iTbx6 T-GFP mESCs with Dox administration for 3 (white) and 7 days (black) (n = 3, independent experiments). Data were normalized to the values of D0–3. (E) Scheme depicting the protocol used to induce skeletal muscle differentiation with a Dox-inducible Tbx6 expression system. (F) The mRNA expression for paraxial/presomitic mesoderm and skeletal muscle genes in iTbx6 T-GFP mESCs with (black, Dox on D08) or without Dox (white, No Dox) (n = 3, independent experiments). Data were normalized to the values of No Dox. (G and H) iTbx6 T-GFP mESCs were differentiated into skeletal muscle lineage under the conditions used. The Doxtreated cells (Dox on D0–8) expressed MyoD and Myogenin after 14 days (G). No MyoD+ or Myogenin+ cells were observed in control (No Dox) wells. Quantitative data are shown in (H). (I–K) Immunocytochemistry for MHC after 21 days (I). Arrowheads indicate multiple nuclei in the MHC+ myotube (J). Quantitative data are shown in (K). All data are presented as the mean ± SD. **p < 0.01; *p < 0.05 versus D0–3 (C and D) or No Dox (F, H, and K). Scale bars represent 100 μm. See also Figures S6 and S7.
Figure 7.
Figure 7.. Transient Tbx6 Expression Induced Mesoderm and Cardiovascular Lineages in Human iPSCs
(A) Schematic representation of the directed cardiac differentiation protocol in human iPSCs. (B) Time course of mRNA expression during hiPSC differentiation determined by qRT-PCR. Data were normalized to the values on day 0. (C)Schematic representation of the lentiviral construct for Doxinducible human Tbx6 expression. Clonal expansion of the iTbx6 hiPSC was confirmed by hKO expression. (D and E) FACS analysis (D) and immunocytochemistry (E) demonstrated that T protein was expressed in the Dox-induced hiPSC nuclei on day 1 of differentiation (n = 3, independent experiments). (F) The mRNA expression for mesoderm, signaling molecules, mesendoderm, and ectoderm genes in iTbx6 hiPSCs with (black, Dox on day –1 to 0) or without Dox (white, No Dox) in the absence of additional cytokines on day 1 (n = 3, independent experiments). Data were normalized to the values of No Dox. (G) Scheme depicting the protocol used to evaluate the effects of Tbx6 expression on Dox induced cardiovascular induction in hiPSCs. (H) FACS profiles for the expression of cTnT in hiPSCs with the indicated Dox protocols (G) and analyzed on day 14. (I and J) The mRNA expression and immunocytochemistry analyses demonstrated that iTbx6 hiPSCs were differentiated into CMs, SMCs, and ECs with Dox administration for 1 day (I). Data were analyzed on day 14 and normalized to the values of No Dox (n = 3, independent experiments), and representative images are shown in (J). All data are presented as the mean ± SD. **p < 0.01; *p < 0.05 versus day 0 (B) or No Dox (D, F, H, and I). Scale bars represent 100 μm.

Similar articles

Cited by

References

    1. Burridge PW, Matsa E, Shukla P, Lin ZC, Churko JM, Ebert AD, Lan F, Diecke S, Huber B, Mordwinkin NM, et al. (2014). Chemically defined generation of human cardiomyocytes. Nat. Methods 11, 855–860. - PMC - PubMed
    1. Chal J, and Pourquié O (2017). Making muscle: Skeletal myogenesis in vivo and in vitro. Development 144, 2104–2122. - PubMed
    1. Chal J, Oginuma M, Al Tanoury Z, Gobert B, Sumara O, Hick A, Bousson F, Zidouni Y, Mursch C, Moncuquet P, et al. (2015). Differentiation of pluripotent stem cells to muscle fiber to model Duchenne muscular dystrophy. Nat. Biotechnol 33, 962–969. - PubMed
    1. Chan SS, Shi X, Toyama A, Arpke RW, Dandapat A, Iacovino M, Kang J, Le G, Hagen HR, Garry DJ, and Kyba M (2013). Mesp1 patterns mesoderm into cardiac, hematopoietic, or skeletal myogenic progenitors in a context-dependent manner. Cell Stem Cell 12, 587–601. - PMC - PubMed
    1. Chan SS, Hagen HR, Swanson SA, Stewart R, Boll KA, Aho J, Thomson JA, and Kyba M (2016). Development of bipotent cardiac/skeletal myogenic progenitors from MESP1+ mesoderm. Stem Cell Reports 6, 26–34. - PMC - PubMed

Publication types