. 2018 Sep 6;23(3):370-381.e5.
doi: 10.1016/j.stem.2018.07.003. Epub 2018 Aug 9.

Distinct Bone Marrow Sources of Pleiotrophin Control Hematopoietic Stem Cell Maintenance and Regeneration

Affiliations

Distinct Bone Marrow Sources of Pleiotrophin Control Hematopoietic Stem Cell Maintenance and Regeneration

Heather A Himburg et al. Cell Stem Cell. .

Abstract

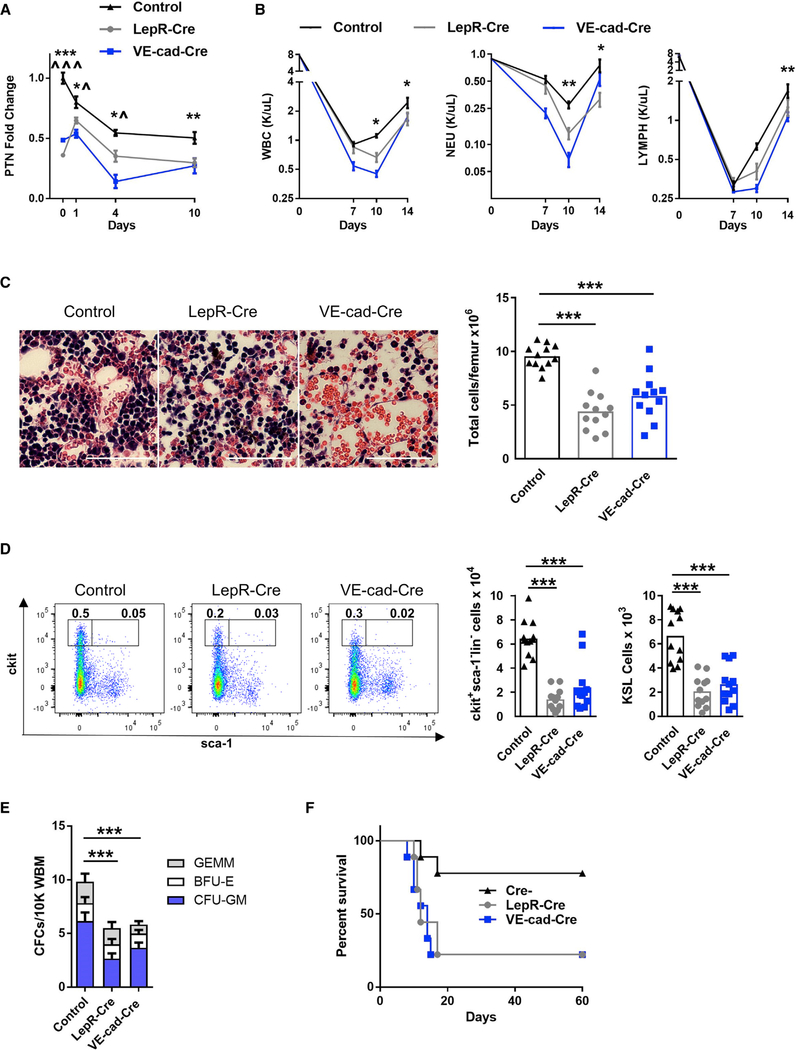
Bone marrow (BM) perivascular stromal cells and vascular endothelial cells (ECs) are essential for hematopoietic stem cell (HSC) maintenance, but the roles of distinct niche compartments during HSC regeneration are less understood. Here we show that Leptin receptor-expressing (LepR+) BM stromal cells and ECs dichotomously regulate HSC maintenance and regeneration via secretion of pleiotrophin (PTN). BM stromal cells are the key source of PTN during steady-state hematopoiesis because its deletion from stromal cells, but not hematopoietic cells, osteoblasts, or ECs, depletes the HSC pool. Following myelosuppressive irradiation, PTN expression is increased in bone marrow endothelial cells (BMECs), and PTN+ ECs are more frequent in the niche. Moreover, deleting Ptn from ECs impairs HSC regeneration whereas Ptn deletion from BM stromal cells does not. These findings reveal dichotomous and complementary regulation of HSC maintenance and regeneration by BM stromal cells and ECs.

Keywords: endothelial cells; hematopoiesis; microenvironment; niche; pleiotrophin; regeneration; self-renewal; stem cells.


Conflict of interest statement

DECLARATION OF INTERESTS

The authors declare no competing interests.

Figures

Figure 1.
Figure 1.. PTN Is Expressed by VE-cad+ ECs and LepR+ Stromal Cells in the BM Vascular Niche
(A–J) Representative 40× confocal images of 100-μm femur sections from LepRCre;ROSA26-TdTomato;PTNEGFP mice showing DAPI nuclear counterstain (A, blue), PTN expression (B, green), VE-cad expression (C, red), and LepR expression (D, white). Merged image is shown in (E). Scale bars, 50 μm. Co-localization of PTN and VE-cad expression is shown at 40× (F) and magnified in (G). Co-localization of PTN and LepR expression is shown at 40× in (H) and magnified in (I). (J) Shows merged image of PTN, VE-cad, and LepR expression in the BM. Scale bar, 20 μm (G, I, and J). (K) Left: representative flow cytometric analysis of BM CD45VE-cad+ ECs at baseline. Right: histogram showing PTN expression byCD45VE-cad+ ECs. Isotype control is shown in gray. Numbers represent the percentages of cells within the gate. (L) Left: representative flow cytometric analysis of BM CD45CD31+ ECs. Right: representative analysis of CD31+Sca-1 sinusoidal BMECs (sBMECs) and CD31+Sca-1+ arteriolar BMECs (aBMECs) at baseline. (M) Representative flow cytometric analysis of BM CD45LepR+ stromal cells and PTN expression in CD45LepR+ cells. (N) Representative analysis of CXCL12 expression by BM CD45LepR+ stromal cells and PTN expression by BM LepR+CXCL12+ and LepR+CXCL12 cells. (O) Mean percentages of PTN-GFP+ cells within the BM populations shown. ***p < 0.001, n = 6/group. (P) Scatterplots of mean PTN mRNA levels in the BM populations shown. ***p < 0.001, n = 6–8/group. Expression levels were normalized to CD45 and glyceraldehyde-3 phosphate dehydrogenase (GAPDH) expression; one-way ANOVA with Dunnett’s multiple comparison test. See also Figure S1.
Figure 2.
Figure 2.. HSC Maintenance Requires PTN from LepR+ Stromal Cells
(A) Mean levels of Ptn mRNA In BM LepR+ cells from LepR-Cre;Ptn fl/fl mice (Δ/Δ) relative to LepR+ cells from Cre;Ptn fl/fl mice (control [con]). ***p < 0.001, n = 6–8/group. (B) Left: representative microscopic images (40×) of BM cellularity in LepR-Cre;Ptn fl/fl mice (Δ/Δ) and Cre;Ptn fl/fl mice (control) are shown. Scale bar, 50 μm. Right: mean BM cell counts per femur for each group. ***p < 0.001, n = 15/group. (C) Representative flow cytometric analysis of BM KSL cells and CD41/48CD150+ KSL (SLAM KSL) cells in LepR-Cre;PTN fl/fl mice versus control mice. Numbers represent the percentage of cells within the gates. (D) Mean percentage of KSL cells and KSL cells per femur are shown for each group. ***p < 0.001, n = 15/group. (E) Mean percentage of SLAM KSL cells and numbers of SLAM KSL cells are shown for LepR-Cre;Ptn fl/fl mice and control mice. **p < 0.01, n = 15/group. (F) Mean donor CD45.2+ cell engraftment overtime in the PB of recipient CD45.1+ mice following transplantation of 2 × 10⁵ BM cells from Lep-RCre;Ptnfl/fl mice or control mice and 2 × 10⁵ competitor CD45.1+ BM cells. **p < 0.01, ***p < 0.001, n = 10–25/group. A two-way ANOVA with Sidak’s multiple comparisons test was performed. Data represent means ± SEM. (G) Left: representative donor percentage of CD45.2+ CD34Flt-3KSL cells (LT-HSCs) are shown at 12 weeks in the BM of recipient mice transplanted with BM cells from control mice and LepR-Cre;Ptn fl/fl mice (Δ/Δ). Right: mean percentages of CD45.2+ LT-HSCs are shown for each group. ***p < 0.001, n = 15/group. (H) Mean donor CD45.2+ cell engraftment overtime in the PB of secondary recipient CD45.1+ mice transplanted with 1 × 10⁶ BM cells from primary recipient mice along with 2 × 10⁵ competitor CD45.1+ BM cells. *p < 0.05, ***p < 0.001, n = 10–25/group. A two-way ANOVA with Sidak’s multiple comparisons test was performed. Data represent means ± SEM. (I) Left: representative flow cytometric analysis of multilineage donor CD45.2+ cell engraftment at 12 weeks in the BM of secondary transplanted CD45.1+ mice in the groups shown. Right: mean values for donor CD45.2+ myeloid cells (Mac1+Gr1+), B cells (B220+), and T cells (CD3+) in secondary transplanted mice from the two groups are shown. **p < 0.01, ***p < 0.001, n = 25/group. We performed two-sided Student’s t test for all analyses other than indicated. See also Figures S2 and S3.
Figure 3.
Figure 3.. Irradiation Enriches for PTN-Expressing BMECs
(A) Representative magnified confocal images (40×) from 100-μm femur sections isolated from LepRCre;ROSA26-TdTomato;PtnEGFP mice and stained with DAPI, anti-GFP, and VE-cad Alexa 647. Maximum z-intensity projections are shown from non-irradiated mice and 3 days and 10 days following 500 cGy TBI. Scale bar, 20 μm. (B) Manders correlation analysis was performed using the JACOP plug-in in ImageJ. Each data point represents the average Mander’s coefficient (M1)from one field of view from n = 3 independent experiments and n = 7 fields of view analyzed. *p < 0.05, **p < 0.01, ***p < 0.001; post hoc unpaired t test with Bonferroni correction following one-way ANOVA analysis. (C) Representative flow cytometric analysis of BM CD45VE-cad+ ECs and PTN expression within CD45VE-cad+ ECs in non-irradiated mice and on day +3 following 500 cGy TBI. (D) Representative flow cytometric analysis of BM CD45LepR+ stromal cells and PTN expression within CD45LepR+ stromal cells in non-irradiated mice and on day +3 following 500 cGy TBI. (E) Top: mean percentages of PTN+VE-cad+ ECs and PTN+LepR+ stromal cells in non-irradiated mice and over time following 500 cGy TBI. Bottom: the mean fluorescence intensity (MFI) of PTN expression in VE-cad+ ECs and LepR+ stromal cells is shown in non-irradiated mice and over time following 500 cGy TBI. *p < 0.05, **p < 0.01, ***p < 0.001, n = 6/group, two-way ANOVA. Data represent means ± SD. (F) Scatterplots showing the percentages of PTN+CD31+Sca-1 sBMECs and PTN+CD31+Sca-1+ aBMECs in non-irradiated mice and over time following 500 cGy TBI. ***p < 0.001, n = 6/group, one-way ANOVA. (G) Bar graph showing the fold change in PTN gene expression within the BM cell populations shown. mRNA levels were normalized to CD45 and GAPDH expression. *p < 0.05, n = 4–9/group, multiple t test with Holm-Sidak correction. Mean values ± SD are shown. See also Figure S4.
Figure 4.
Figure 4.. PTN Is Required from LepR+ Stromal Cells and VEcad+ ECs for Hematologic Recovery and Survival after Irradiation
(A) Mean levels of PTN In the BM of control mice (Cre), LepR-Cre;Ptn fl/fl mice (LepR-Cre) and VE-cadCre;Ptn fl/fl mice (VE-cad-Cre) at steady state (non-Irradlated) and on day +1, day +4, and day +10 after 500 cGy TBI. *p < 0.05, **p < 0.01, and ***p < 0.001 for comparison of controls with both LepR-Cre and VE-cad-Cre mice. ^p < 0.05 and ^^^p < 0.001 for comparison of LepR-Cre with VE-cad-Cre mice. n = 4–10/group; two-way ANOVA with Tukey multiple comparisons test. Data represent means ± SEM. (B) PB white blood cell (WBC), neutrophil (NEU), and lymphocyte (LYMPH) counts in non-irradiated mice, LepR-Cre mice, and VE-cad-Cre mice and overtime following 500 cGy TBI. *p < 0.05 and **p < 0.01 for comparison of control mice with LepR-Cre and VE-cad-Cre mice. n = 5–12/group; two-way ANOVA with Dunnett’s multiple comparisons test. Data represent means ± SEM. (C) Left: representative H&E images (20×) from the mouse groups shown on day +10 following 500 cGy TBI. Scale bars, 100 μm. Right: mean BM cell counts from each group. ***p < 0.001, n = 12/group; one-way ANOVA with Dunnett’s multiple comparisons test. (D) Left: representative flow cytometric analysis of percentages of BM ckit+sca-1lin cells and KSL cells in the mouse groups shown on day +10. Right, mean numbers of BM ckit+sca-1lin myeloid progenitor cells and KSL cells in each group on day +10. ***p < 0.001; n = 12/group; one-way ANOVA with Dunnett’s multiple comparisons test. (E) Mean numbers of BM CFCs in the groups shown on day +10 following 500 cGy TBI. ***p < 0.01, n = 6/group; two-way ANOVA with Dunnett’s multiple comparisons test. Data represent means ± SEM. (F) Percent survival of the mice groups shown through day +60 following 700 cGy TBI. p = 0.01 for controls versus LepR-Cre;Ptn fl/fl mice, p = 0.01 for controls versus VE-cad-Cre;Ptn fl/fl mice, n = 9/group, log rank test for survival analysis. See also Figure S4.
Figure 5.
Figure 5.. HSC Regeneration Requires PTN from VE-cad+ ECs
(A) Representative flow cytometric plots show decreased engraftment of donor CD45.2+ cells in the BM of CD45.1+ recipient mice 12 weeks following transplantation of 1 × 10⁶ BM CD45.2+ cells collected from irradiated control mice, LepR-Cre;Ptn fl/fl mice, or VE-cad-Cre;Ptn fl/fl mice along with 2 × 10⁵ competitor CD45.1+ BM cells. (B) Scatterplots showing mean total donor CD45.2+ cell engraftment and donor CD45.2+ cell engraftment within Mac1Gr1 (myeloid), B220 (B cell), and CD3 (T cell) populations in the BM of recipient CD45.1+ mice 12 weeks following transplantation of BM cells from irradiated VE-cad-Cre;Ptn fl/fl mice, control mice, or LepR-Cre;Ptn fl/fl mice. **p <0.01, ***p < 0.001, n = 20/group. (C) Left: representative histograms show donor CD45.2+ cell engraftment within BM LT-HSCs in recipient mice 12 weeks following transplantation of BM cells from irradiated VE-cad-Cre;Ptnfl/fl mice, control mice, or LepR-Cre;Ptnfl/fl mice. Right: mean donor CD45.2+ cell engraftment in the LT-HSC population for each group. **p < 0.01, ***p < 0.001, n = 20/group. (D) Representative flow cytometric analysis of donor CD45.2+ cell engraftment in the BM of secondary recipient mice 12 weeks following transplantation of 3 × 10⁶ BM cells collected from primary recipient mice in each group (represented in B) along with 2 × 10⁵ CD45.1+ competitor BM cells. (E) Scatterplots showing the mean total donor CD45.2+ cell engraftment and donor cell engraftment within BM myeloid, B cells, and T cells in secondary recipient mice in each group at 12 weeks. **p < 0.01, ***p < 0.001, n = 18–19/group; Kruskal-Wallis test (one-way non-parametric ANOVA) with Dunn’s multiple comparisons test for all analyses. See also Figure S5.

References

    1. Acar M, Kocherlakota KS, Murphy MM, Peyer JG, Oguro H, Inra CN, Jaiyeola C, Zhao Z, Luby-Phelps K, and Morrison SJ (2015). Deep imaging of bone marrow shows non-dividing stem cells are mainly perisinusoidal. Nature 526, 126–130. - PMC - PubMed
    1. Alva JA, Zovein AC, Monvoisin A, Murphy T, Salazar A, Harvey NL, Carmeliet P, and Iruela-Arispe ML (2006). VE-Cadherin-Cre-recombinase transgenic mouse: a tool for lineage analysis and gene deletion in endothelial cells. Dev. Dyn 235, 759–767. - PubMed
    1. Asada N, Kunisaki Y, Pierce H, Wang Z, Fernandez NF, Birbrair A, Ma’ayan A, and Frenette PS (2017). Differential cytokine contributions of perivascular haematopoietic stem cell niches. Nat. Cell Biol 19, 214–223. - PMC - PubMed
    1. Cashman JD, and Eaves CJ (1999). Human growth factor-enhanced regeneration of transplantable human hematopoietic stem cells in nonobese diabetic/severe combined immunodeficient mice. Blood 93, 481–487. - PubMed
    1. Chauhan AK, Li YS, and Deuel TF (1993). Pleiotrophin transforms NIH 3T3 cells and induces tumors in nude mice. Proc. Natl. Acad. Sci. USA 90, 679–682. - PMC - PubMed

Publication types

LinkOut - more resources