. 2018 Sep 20;175(1):146-158.e15.
doi: 10.1016/j.cell.2018.07.016. Epub 2018 Aug 9.

Cooperative Metabolic Adaptations in the Host Can Favor Asymptomatic Infection and Select for Attenuated Virulence in an Enteric Pathogen

Affiliations

Cooperative Metabolic Adaptations in the Host Can Favor Asymptomatic Infection and Select for Attenuated Virulence in an Enteric Pathogen

Karina K Sanchez et al. Cell. .

Abstract

Pathogen virulence exists on a continuum. The strategies that drive symptomatic or asymptomatic infections remain largely unknown. We took advantage of the concept of lethal dose 50 (LD50) to ask which component of individual non-genetic variation between hosts defines whether they survive or succumb to infection. Using the enteric pathogen Citrobacter, we found no difference in pathogen burdens between healthy and symptomatic populations. Iron metabolism-related genes were induced in asymptomatic hosts compared to symptomatic or naive mice. Dietary iron conferred complete protection without influencing pathogen burdens, even at 1000× the lethal dose of Citrobacter. Dietary iron induced insulin resistance, increasing glucose levels in the intestine that were necessary and sufficient to suppress pathogen virulence. A short course of dietary iron drove the selection of attenuated Citrobacter strains that can transmit and asymptomatically colonize naive hosts, demonstrating that environmental factors and cooperative metabolic strategies can drive conversion of pathogens toward commensalism.

Keywords: Citrobacter rodentium; antivirulence; asymptomatic persistent infections; commensalism; cooperative defenses; dietary iron; host-pathogen interactions; insulin resistance.


Conflict of interest statement

Declaration of Interests. The authors declare no conflicts of interest.

Figures

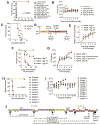
Figure 1.
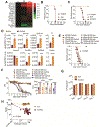
Figure 1.. LD50 analysis reveals physiologies associated with co-operative defenses.
(A-E) C3H/HeJ mice orally infected with an LD0 (n=10), LD50 (n=10) or LD100 (n=8) dose of CR. (A) Survival (B) Weight loss (C) Stool scores (D) Morbidity scores (E) Daily disease activity index scores. Beginning at day 7 post-infection, stool score was no longer used to generate a DAI because sick animals stopped pooping. Red dashed line indicates this. (F) CFU analysis of from healthy and morbid mice challenged with an LD50 dose of CR at day 8 post-infection. n=5 per condition. (G) Average log2fold FPKM expression of genes significantly up in livers from infected healthy (IH) compared to infected morbid (IM) (log2fold > 1, FDR < 0.01) normalized to uninfected (U) control, n=3 mice per condition. (H) Top KEGG pathways showing overrepresentation of genes up in IH compared to IM. Data from (A-F) ***p<.001, ****p<0.0001. In (B) asterisk indicate significance between LD50 animals with >100% original weight compared to LD50 animals <100% original weight. In (C) asterisks indicate significance between LD50 animals with 2 stool score compared to LD50 animals with <2 stool score. In (D) asterisk indicate LD50 mice with morbidity score of 5 compared to LD50 mice with score <5. In (E) asterisk indicate LD50 mice with DAI of 12 (or 10 beginning day 7) compared to LD50 mice <12 (or 10). Error bars +/− SEM.
Figure 2.
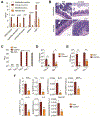
Figure 2.. Dietary iron promotes co-operative defenses against lethal doses of CR.
(A) Average log2fold FPKM expression of iron metabolism genes from livers of healthy infected (IH) and infected dying (IM) mice challenged with an LD50 dose of CR in Figure 1 normalized to uninfected (U) control. n=3 per condition. (B) Survival of C3H/HeJ mice orally infected with an LD100 dose of CR and given 2% carbonyl iron for 14 days n=5/condition. (C) Survival of C3H/HeJ mice orally infected with an LD100 dose of CR and given 2% carbonyl iron or control chow by pairwise feeding. n=10/condition. (D) qPCR analysis of iron regulated genes in the liver of CR infected mice fed 2% carbonyl iron or control diet n=9-10 mice/condition. (E) Survival of mice orally infected with 1×-1000× the LD100 dose of CR and given 2% carbonyl iron for 14 days or control diet. n=5-15 mice/condition. (F) Daily DAI of mice from (E) and area under the curve analysis for each individual mouse. (G) Levels of CR in feces of mice infected with an LD100 dose of CR. n=5 mice/condition. (H) The integral of DAI curves and fecal shedding curves were taken for each mouse in (E) and plotted against each other. *p<0.05, **p<0.01, ***p<0.0005, ****p<0.0001. Error bars +/− SEM. Related to Figure S1.
Figure 3.
Figure 3.. Dietary iron protects from CR induced intestinal damage.
(A) Cecum pathology scores of mice infected with an LD100 dose of CR given 2% carbonyl iron or control chow at day 9 post-infection n=5 mice/condition. (B) representative images from mice in (A). Scale bar = 100 microns (C) Serum FITC-dextran levels of CR infected mice fed iron or control chow n=5 mice/condition/time point. DSS used as positive control. (D-E) CR CFUs in (D) liver and (E) spleen of iron and control chow fed mice at day 5 and 7 post-infection n=4-5 mice per condition. Red dotted line indicates limit of detection. (F) Cytokine transcript levels in livers of CR infected mice fed iron or control chow at day 7 post-infection n=5 mice per condition. *p<0.05, **p<0.01, ***p<0.005, ****p<0.0001. Error bars +/− SEM. Related to Figure S2.
Figure 4.
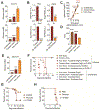
Figure 4.. Iron suppresses virulence factor expression in vivo.
(A-D) Gene expression analysis of stated virulence factors in the intestines of mice fed 2% carbonyl iron or control chow at indicated time points. n=4-5 mice per condition per time point. (E-H) Gene expression analysis of stated virulence factors of CR grown in various concentrations of iron rich media at 6 hrs post culture inoculation. n=3 replicates per condition. (I) Survival of germ free mice infected with CR and given control or 2% carbonyl iron during infection. n=6-7 mice per condition. *p<0.05, **p<0.01., ***p<0.001, ****p<0.0001. Error bars +/− SEM. Related to Figure S3.
Figure 5.
Figure 5.. Iron increases glucose availability in the intestine.
(A) Luminal levels of glucose in cecum and colon at day 3 post-infection of mice fed control (n=10) or iron chow (n=10). Uninfected (n=10). (B) Gene expression of virulence factors of CR grown in glucose rich media at 6 hrs post-culture inoculation. n=3 replicates per condition. (C) Blood glucose levels of infected mice fed control (n=20) or iron chow (n=20) after bolus glucose gavage at day 3 post-infection. Uninfected (n=20). (D) Area under the curve analysis of mice from (C). (E) Glucose levels in the jejunum of infected mice fed control (n=10) or iron (n=10) chow. Uninfected (n=10). (F) Survival of mice infected with an LD100 dose of CR and given control chow or iron chow and oral acarbose treatment n=5 mice per condition. (G) Mice were orally infected with an LD100 dose of CR and fed control chow with control water (n=20) or water supplemented with glucose (n=12). Survival shown. (H) Mice were orally infected with an LD100 dose of CR and fed control chow and injected with glucose (n=4) or PBS (n=5) over the course of the infection. Survival shown. *p<0.05, **p<0.01., ***p<0.001, ****p<0.0001. In (C) red * is iron chow compared to control chow and brown * is iron chow compared to uninfected. Error bars +/− SEM. Related to Figure S4.
Figure 6.
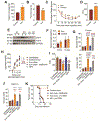
Figure 6.. Iron induced insulin resistance is necessary and sufficient for protection from CR
(A-F) C3H/HeJ mice were orally infected with an LD100 dose of CR and fed control or iron chow and (A) WAT iron content (n=12 mice/condition) (B) percent body fat (n=5 mice/condition) (C-D) insulin tolerance test (n=10 mice/condition) (E) insulin signaling in WAT and (F) circulating insulin levels (n=10 mice/condition) at day 3 post-infection. (G) Luminal glucose concentration of cecum and colon from mice orally infected with LD100 dose of CR and given stated diet treatment. (n=3-5 mice per condition). (H) Infected mice fed control (n=20), iron chow (n=18), iron chow plus metformin (n=21), high fat diet (HFD, n=22) were gavaged with glucose at day 3 post-infection and the change in blood glucose levels were measured. Uninfected (n=28) (I) Area under the curve analysis of mice from (H). (J) Glucose levels in the jejunum luminal content of infected and uninfected mice given stated treatment (n=3-5 mice/condition). (K) Survival of infected mice given control chow (n=13), iron chow (n=15), iron chow plus metformin (n=9) or raised on HFD and given normal chow during infection (n=15). p values in K represent iron chow compared to control chow and iron chow/metformin and HFD compared to control chow and iron chow/metformin*p<0.05, **p<0.01, ***p=0.0005, ****p<0.0001. In (G, I, J) red * indicate comparison between to control chow. brown * indicates comparison to uninfected and blue * indicates comparison to iron chow-metformin. In (H) * indicates comparison between iron and other conditions. # indicates comparison between HFD and other conditions. Related to Figure S5 and S6.
Figure 7.
Figure 7.. Dietary iron drives long term attenuation of an enteric pathogen.
(A) Survival and (B) CR fecal shedding of mice from Figure 2E. p values were <0.0001 for each dose that received iron diet compared to the same dose that received control chow. (C) C3H/HeJ mice were orally infected with 7.5×10⁸ CFU dose of CR. Single infected mice were housed with one naïve mouse. Mice were given control chow. Survival shown. n=10/condition. (D) Schematic of experimental set up for mice in (E-G), n=10/condition. (E) Fraction of naïve mice shedding CR. (F) Survival of naïve mice that were co-housed with CR infected mice fed iron diet 3, 10 or 45 days after iron food withdrawal from infected mice as shown in (D). (G) amount of CR being shed in the feces by mice in (F). (H-I) C3H/HeJ were orally infected with 7.5×10⁸ CFU dose of parental CR or 7.5×10⁸ CFU dose of CR isolates from mice that were infected with the parental strain and fed a 14-day course of dietary iron and given control chow, n=5-10/condition. (H) Survival. p<0.0001 comparing parental to each isolate. (I) Fecal shedding of CR. (J) Mutations in the attenuated isolates from (H-I). Related to Figure S7.

Comment in

References

    1. Afgan E, Baker D, van den Beek M, Blankenberg D, Bouvier D, Cech M, Chilton J, Clements D, Coraor N, Eberhard C, et al. (2016). The Galaxy platform for accessible, reproducible and collaborative biomedical analyses: 2016 update. Nucleic Acids Res 44, W3–W10. - PMC - PubMed
    1. Agoro R, Benmerzoug S, Rose S, Bouyer M, Gozzelino R, Garcia I, Ryffel B, Quesniaux VFJ, and Mura C (2017). An Iron-Rich Diet Decreases the Mycobacterial Burden and Correlates With Hepcidin Upregulation, Lower Levels of Proinflammatory Mediators, and Increased T-Cell Recruitment in a Model of Mycobacterium bovis Bacille Calmette-Guerin Infection. J Infect Dis 216, 907–918. - PubMed
    1. Andrews (2010). FastQC: a quality control tool for high throughput sequence data. Available online at:http://www.bioinformatics.babraham.ac.uk/proiects/fastqc.
    1. Ayres JS (2016). Cooperative Microbial Tolerance Behaviors in Host-Microbiota Mutualism. Cell 165, 1323–1331. - PMC - PubMed
    1. Bankevich A, Nurk S, Antipov D, Gurevich AA, Dvorkin M, Kulikov AS, Lesin VM, Nikolenko SI, Pham S, Prjibelski AD, et al. (2012). SPAdes: a new genome assembly algorithm and its applications to single-cell sequencing. J Comput Biol 19, 455–477. - PMC - PubMed

Publication types

MeSH terms