. 2018 Sep 6;174(6):1586-1598.e12.
doi: 10.1016/j.cell.2018.07.009. Epub 2018 Aug 9.

Generation of Tumor-Reactive T Cells by Co-culture of Peripheral Blood Lymphocytes and Tumor Organoids

Affiliations

Generation of Tumor-Reactive T Cells by Co-culture of Peripheral Blood Lymphocytes and Tumor Organoids

Krijn K Dijkstra et al. Cell. .

Abstract

Cancer immunotherapies have shown substantial clinical activity for a subset of patients with epithelial cancers. Still, technological platforms to study cancer T-cell interactions for individual patients and understand determinants of responsiveness are presently lacking. Here, we establish and validate a platform to induce and analyze tumor-specific T cell responses to epithelial cancers in a personalized manner. We demonstrate that co-cultures of autologous tumor organoids and peripheral blood lymphocytes can be used to enrich tumor-reactive T cells from peripheral blood of patients with mismatch repair-deficient colorectal cancer and non-small-cell lung cancer. Furthermore, we demonstrate that these T cells can be used to assess the efficiency of killing of matched tumor organoids. This platform provides an unbiased strategy for the isolation of tumor-reactive T cells and provides a means by which to assess the sensitivity of tumor cells to T cell-mediated attack at the level of the individual patient.

Keywords: T cell; adoptive cell transfer; colorectal cancer; immune checkpoint blockade; immunotherapy; microsatellite instable; mismatch repair deficient; non-small cell lung cancer; organoids.


Conflict of interest statement

Declaration of interests

H.C. is inventor on several patents related to organoid technology.

N.S. reports grants from The Netherlands Organisation for Scientific Research, during the conduct of the study; other from Vertex Pharmaceuticals Incorporated, outside the submitted work; In addition, N.S. has a patent PCT/EP2015/077990 with royalties paid to Stichting HUB, and a patent PCT/EP2015/077988 with royalties paid to Stichting HUB.

Figures
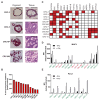
Figure 1
Figure 1. Characterization of a panel of dMMR CRC organoids.
(A) Haematoxylin and eosin (H&E) staining of tumor organoids and original tumor tissue. Organoids show morphology similar to the architecture of the original tumor. CRC-2 organoids demonstrates cystic tubules similar to mucin-filled glands of the primary tumor. CRC-5 organoids and primary tumor are composed of tubular glands with layered epithelium. Organoid CRC-6P is composed of complex cribriform glands, also seen in the primary tumor. Organoid CRC-6M consists of irregular trabecular structures and poorly formed glands, similar to the metastasis. Scale bar = 100 μm. (B) Mutational load of tumor organoids as determined by the number of non-synonymous mutations per tumor exome. (C) Mutation status of genes significantly mutated in hypermutated colorectal cancer according to TCGA 2012. Mutated genes are indicated in red. (D) Cell surface MHC-I expression as determined by flow cytometry. Organoids were stimulated with 200 ng/mL IFNγ for 24 hours or left unstimulated. Bar graphs indicate median fluorescence intensity (MFI) of anti-HLA-A,B,C-PE minus MFI of isotype control. Tumor organoids with MFI < 250 above isotype control (dashed line) were classified as MHC-I deficient (indicated in red). Error bars indicate s.e.m. of at least two independent experiments. (E) Cell surface PD-L1 expression as determined by flow cytometry. Organoids were stimulated with 200 ng/mL IFNγ for 24 hours or left unstimulated. Bar graphs indicate median fluorescence intensity (MFI) of anti-PD-L1-APC minus MFI of isotype control. Error bars indicate s.e.m. of at least two independent experiments. See also Figures S1-S2 and Tables S1-S2.
Figure 2
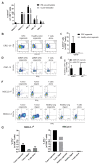
Figure 2. Induction of tumor reactivity in circulating T cells by co-culture with autologous tumor organoids.
(A) Experimental workflow. Tumor organoids were established from dMMR CRC (resections or biopsies of primary tumors or metastases) and stimulated with IFNγ for 24 hours prior to co-culture with peripheral blood lymphocytes (PBL) from the same patient. PBL were stimulated weekly with fresh tumor cells. After two weeks of co-culture, T cell effector functions and sensitivity of tumor organoids to T cell-mediated killing were evaluated using flow cytometry. (B) Representative flow cytometry plots gated on CD8+ T cells tested for reactivity against autologous organoids after two weeks of co-culture with autologous tumor organoids. (C) Quantification of organoid-induced IFNγ production and CD107a cell surface expression of CD8+ T cells obtained by two week co-culture with autologous tumor organoids. Background (spontaneous IFNγ production or CD107a expression) is subtracted from signal. Error bars indicate s.e.m. of at least 2 biological replicates. Dots indicate biological replicates. (D) Flow cytometry plots gated on CD8+ T cells of patient CRC-9 tested for reactivity against autologous organoids directly after PBL isolation, or after two weeks of co-culture with autologous tumor organoids. (E) Quantification of organoid-induced IFNγ production and CD107a cell surface expression of CD8+ T cells directly after PBL isolation, or obtained by two week co-culture with autologous tumor organoids. Background (spontaneous IFNγ production or CD107a expression) is subtracted from signal. Error bars indicate s.e.m of n = 2 biological replicates for CRC-9 and CRC-11. N = 1 for CRC-12 and CRC-13 (low amount of blood available).
Figure 3
Figure 3. Induction of tumor reactivity in circulating T cells from patients with NSCLC.
(A) Haematoxylin and eosin staining of tumor organoids and original tumor tissue. Organoids show morphology similar to the architecture of the original tumor. NSCLC-1 organoids consists of large cells forming a solid mass, similar to the primary tumor. NSCLC-5 organoids are composed of tubular glands similar to the original tumor. Scale bar = 100 μm. (B-C) Cell surface MHC-I (B) and PD-L1 (C) expression as determined by flow cytometry. Organoids were stimulated with 200 ng/mL IFNγ for 24 hours or left unstimulated. Bar graphs indicate median fluorescence intensity (MFI) of anti-HLA-A,B,C-PE or anti-PD-L1-APC minus MFI of isotype control. Error bars indicate s.e.m. of two independent experiments. (D) Representative flow cytometry plots gated on CD8+ T cells tested for reactivity against autologous organoids after two weeks of co-culture with autologous tumor organoids. (E) Quantification of organoid-induced IFNγ production and CD107a cell surface expression of CD8+ T cells obtained by two week co-culture with autologous tumor organoids. Background (spontaneous IFNγ production or CD107a expression) is subtracted from signal. Error bars indicate s.e.m. of at least 2 biological replicates. Dots indicate biological replicates. (F) Quantification of organoid-induced IFNγ production and CD107a cell surface expression of CD8+ T cells directly after PBL isolation, or obtained by two week co-culture with autologous tumor organoids. Background (spontaneous IFNγ production or CD107a expression) is subtracted from signal. Error bars indicate s.e.m of n = 2 biological replicates. See also Figure S3.
Figure 4
Figure 4. Specificity of organoid-reactive T cell responses.
T cells were obtained by two week co-culture with autologous tumor organoids. To increase the number of T cells available for testing, where indicated (lower case e) tumor-reactive T cells were then expanded using a rapid expansion protocol (Dudley et al. 2013), in some cases preceded by CD137-based enrichment of tumor-reactive cells (indicated by upper case E). (A) T cells were challenged with organoids pre-stimulated with 200 ng/mL IFNγ for 24 hours or with unstimulated organoids and evaluated for expression of the activation marker CD137. Background (percentage positive cells in T cells alone control) is subtracted from signal. Error bars indicate s.e.m. of at least 2 biological replicates. (B) Representative flow cytometry plots of CD8+ T cells stimulated with either tumor organoids or healthy colon organoids. (C) Quantification of CD137 expression by CD8+ T cells stimulated with either tumor organoids or healthy colon organoids. Background (percentage positive cells in T cells alone control) is subtracted from signal. Error bars indicate s.e.m. of 2 biological replicates. One of the replicates for T cells stimulated with tumor organoids is the same as data in (A). (D) Representative flow cytometry plots of CD8+ T cells obtained by two weeks of co-culture with mismatch repair deficient (dMMR) CRC organoids that were re-stimulated with either dMMR CRC organoids or mismatch repair proficient (pMMR) CRC organoids. (E) Quantification of organoid-induced IFNγ production and CD107a cell surface expression of CD8+ T cells obtained by two weeks of co-culture with mismatch repair deficient (dMMR) CRC organoids that were re-stimulated with either dMMR CRC organoids or mismatch repair proficient (pMMR) CRC organoids. Background (percentage positive cells in T cells alone control) is subtracted from signal. Error bars indicate s.e.m. of 4 biological replicates. Data for T cells stimulated with dMMR CRC organoids is the same as data in Figure 2A. (F) Representative flow cytometry plots of CD8+ T cells stimulated with either tumor digest, normal lung digest, NSCLC organoids or healthy lung organoids. (G) Quantification of IFNγ production of CD8+ T cells stimulated with either tumor digest, normal lung digest, NSCLC organoids or healthy lung organoids. Error bars represent s.d. of technical replicates.
Figure 5
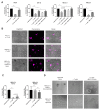
Figure 5. CD4+ T cell reactivity against xenogeneic tissue culture components.
(A) Quantification of spontaneous and organoid-induced IFNγ production by CD4+ T cells obtained by two week co-culture with autologous tumor organoids. Error bars indicate s.e.m. of at least 2 biological replicates. (B) Quantification of CD137 expression by CD4+ T cells upon re-stimulation with the tumor organoids used for induction, normal colon organoids, or organoids of a mismatch repair proficient (pMMR) CRC from the same patient. T cells were obtained by two week co-culture with autologous tumor organoids and where indicated (lower case e) further expanded using a rapid expansion protocol (Dudley et al. 2013), in some cases preceded by CD137-based enrichment of tumor-reactive cells (indicated by upper case E). Error bars indicate s.e.m. of at least 2 biological replicates. (C) Quantification of CD137 expression by CD4+ T cells after stimulation with unloaded or Geltrex-loaded monocyte-derived dendritic cells (DCs), irradiated tumor cells, or organoids cultured with or without Geltrex. Error bars indicate s.d. of technical replicates. See also Figure S4.
Figure 6
Figure 6. Tumor organoids are killed by autologous tumor-reactive T cells.
T cells were obtained by two week co-culture with autologous tumor organoids and where indicated (lower case e) further expanded using a rapid expansion protocol (Dudley et al. 2013), in some cases preceded by CD137-based enrichment of tumor-reactive cells (indicated by upper case E). (A) Quantification of organoid killing upon T cell co-culture. After 3 days of co-culture, organoids were dissociated into single cells and the number of live cells was quantified using flow cytometry in the presence of counting beads. Where indicated, MHC-I or MHC-II was blocked with W6/32 or Tü39 antibody, respectively. * p < 0.05, ** p < 0.01, *** p < 0.001, Student’s t test. Error bars indicate s.e.m. of at least two biological replicates. (B) Microphotographs of NSCLC-1 organoids 72 hours after culture with or without T cells in the presence of a green-fluorescent caspase 3/7 probe. Organoids were labelled with CellTrace Yellow (magenta) prior to co-culture. Note the appearance of apoptotic (green) cells upon addition of T cells. When MHC-I and MHC-II are blocked, T cells cluster around organoids but apoptosis is reduced and organoids remain larger in size. (C) Quantification of killing of matched NSCLC and healthy lung organoids as in (A). Representative of two independent experiments. Error bars indicate s.d. of technical replicates. (D) Microphotograph images of NSCLC-3 healthy and tumor organoids 72 hours after culture with or without T cells in the presence of a green-fluorescent caspase 3/7 probe. See also Figure S5.

Comment in

Similar articles

Cited by

References

    1. Alexandrov LB, Nik-Zainal S, Wedge DC, Aparicio SA, Behjati S, Biankin AV, Bignell GR, Bolli N, Borg A, Børessen-Dale AL, et al. Signatures of mutational processes in human cancer. Nature. 2013;500:415–421. - PMC - PubMed
    1. Blank CU, Haanen JB, Ribas A, Schumacher TN. CANCER IMMUNOLOGY. The “cancer immunogram”. Science. 2016;352:658–660. - PubMed
    1. Borghaei H, Paz-Ares L, Horn L, Spigel DR, Steins M, Ready NE, Chow LQ, Vokes EE, Felip E, Holgado E, et al. Nivolumab versus docetaxel in advanced nonsquamous non-small cell lung cancer. N Engl J Med. 2015;373:1627–1639. - PMC - PubMed
    1. Brea EJ, Oh CY, Manchado E, Budh S, Gejman RS, Mo G, Mondello P, Han JE, Jarvis CA, Ulmert D, et al. Kinase regulation of human MHC class I molecule expression on cancer cells. Cancer Immunol Res. 2016;4:936–947. - PMC - PubMed
    1. Cingolani P, Platts A, Wang Ie L, Coon M, Nguyen T, Wang L, Land SJ, Lu X, Ruden DM. A program for annotating and predicting the effects of single nucleotide polymorphisms, SnpEff: SNPs in the genome of Drosophila melanogaster strain w1118; iso-2; iso-3. Fly (Austin) 2012;6:80–92. - PMC - PubMed

Publication types

MeSH terms

Substances