. 2018 Aug 20;28(16):2515-2526.e4.
doi: 10.1016/j.cub.2018.07.009. Epub 2018 Aug 9.

Phase-Locked Stimulation during Cortical Beta Oscillations Produces Bidirectional Synaptic Plasticity in Awake Monkeys

Affiliations

Phase-Locked Stimulation during Cortical Beta Oscillations Produces Bidirectional Synaptic Plasticity in Awake Monkeys

Stavros Zanos et al. Curr Biol. .

Abstract

The functional role of cortical beta oscillations, if any, remains unresolved. During oscillations, the periodic fluctuation in excitability of entrained cells modulates transmission of neural impulses and periodically enhances synaptic interactions. The extent to which oscillatory episodes affect activity-dependent synaptic plasticity remains to be determined. In nonhuman primates, we delivered single-pulse electrical cortical stimulation to a "stimulated" site in sensorimotor cortex triggered on a specific phase of ongoing beta (12-25 Hz) field potential oscillations recorded at a separate "triggering" site. Corticocortical connectivity from the stimulated to the triggering site as well as to other (non-triggering) sites was assessed by cortically evoked potentials elicited by test stimuli to the stimulated site, delivered outside of oscillatory episodes. In separate experiments, connectivity was assessed by intracellular recordings of evoked excitatory postsynaptic potentials. The conditioning paradigm produced transient (1-2 s long) changes in connectivity between the stimulated and the triggering site that outlasted the duration of the oscillatory episodes. The direction of the plasticity effect depended on the phase from which stimulation was triggered: potentiation in depolarizing phases, depression in hyperpolarizing phases. Plasticity effects were also seen at non-triggering sites that exhibited oscillations synchronized with those at the triggering site. These findings indicate that cortical beta oscillations provide a spatial and temporal substrate for short-term, activity-dependent synaptic plasticity in primate neocortex and may help explain the role of oscillations in attention, learning, and cortical reorganization.

Keywords: beta oscillations; closed loop; cortical connectivity; cortical stimulation; nonhuman primates; synaptic plasticity.


Figures

Figure 1.
Figure 1.. Intracellular (IC) and extracellular (EC) recordings during cortical oscillations
(A): Experimental setup. IC electrode impaled motor cortex cell and EC electrodes recorded neighboring activity or stimulated presynaptic cells. (B): Cycle-triggered average aligned with depolarizing phase of EC local field potentials and showing histograms of spikes recorded by IC and EC electrodes, and IC membrane potential (m.p.). Inset shows the precentral locations of the sites from which the recordings were made. (C): EPSPs were evoked by cycle-triggered stimuli during oscillatory episode and by preceding and following test stimuli. (D): superposition of average EPSPs evoked by pre- and post-episode test stimuli.
Figure 2.
Figure 2.. Beta cortical oscillations, closed-loop beta cycle-triggered cortical stimulation and cortically-evoked potentials
(A): Sites in sensorimotor and supplementary motor area in monkey 1. Stimuli at the stimulated site (SS, open blue circle) elicited cortically-evoked potentials at the triggering site (ST, filled red circle): inset shows 30 superimposed stimulus-triggered sweeps (grey), and the average of ~ 600 sweeps (blue). Amplitude of first negative peak was measured (downward red arrow). See also figure S1. (B): Spontaneously occurring episodes of ECoG oscillations (band-pass filtered between 12 and 25 Hz), of approximately 18 Hz frequency, recorded at the 4 selected frontal cortical electrodes shown in A: site close to the stimulated site (SS, light green), non-triggering site (SNT, dark green), site close to the triggering site (ST, brown) and the triggering site (ST, red). Negative phases triggered stimuli to the stimulated site. When oscillations were not detected for at least 500 ms, test stimuli were delivered to the stimulated site. Black traces show raw recordings; colored traces show filtered records. See also figure S2. (C): Average power spectrum of cortical signals recorded from different triggering sites across months of recordings. Red lines show corner frequencies of the beta band-pass filter. Peak beta frequency in this monkey was around 18 Hz (standard deviation of peak frequency: 0.8 Hz (green vertical lines around mean).
Figure 3.
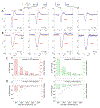
Figure 3.. Bidirectional modification of cortical connectivity by phase-dependent stimulation
(A): Depolarizing phase stimulation produces synaptic potentiation. TOP: Conditioning stimulation was triggered from the negative (depolarizing) phase of oscillatory beta cycles (red vertical bars, C) and test stimuli (T) were delivered, before (orange) and after (blue) conditioning episodes. Cortically-evoked potentials (CEPs) elicited by test stimuli were registered at the triggering site. Traces show the average CEP elicited by test stimuli preceding conditioning episodes with at least 3 cycle-triggered stimuli (orange), and the CEP elicited by test stimuli following the episodes (blue). The amplitude of the first component (downward arrows) of the post-conditioning CEP was 116% larger than that of the pre-conditioning CEP. See also figure S3. BOTTOM: Delivering the same sequence of test and cycle-triggered stimuli, at a later time in open-loop mode produced no significant changes in the CEP amplitude. For additional controls, see figure S4. (B): Hyperpolarizing phase stimulation produces synaptic depression. TOP: Post-conditioning episode CEPs was 27% smaller than pre-conditioning episode CEPs. BOTTOM: No significant changes were seen in CEP amplitude in the control experiment. Red horizontal bars with asterisks indicate the portions of the CEP during which contiguous samples are significantly different in the pre- vs post-conditioning comparison (at the p=0.001 confidence level). (C): Magnitude of the conditioning effect in individual experiments as a function of the effective stimulation phase (0 to 350 degrees). Conditioning effect was defined as the percent change of amplitude between CEPs elicited from test stimuli preceding bursts of 3 or more cycles and from test stimuli immediately following those bursts. Vertical lines mark 0, 180 and 360 degrees. Ten randomly selected data points from control experiments (5 from each monkey) are shown to the left of the 0 degrees line. Open circles denote the 5 experiments in which there were no significant changes in the CEP shapes. (D): Average magnitude of the conditioning effects. Bars show collective results for 3 groups of experiments: control, HPS and DPS. For HPS experiments the effective mean instantaneous stimulation phase (ISP) was between 0 and 180 degrees, and for DPS mean ISP was between 180 and 360 degrees. Bars: mean+/−SD, numbers: n. of observations in that group. The conditioning effects in closed-loop stimulation experiments were greater than in respective control experiments, both for HPS sessions (p=0.012 and p=0.037 for monkey 1 and 2, respectively; paired t-test assuming unequal variances) and for DPS sessions (p<0.001 for both monkeys; paired t-test assuming unequal variances).
Figure 4.
Figure 4.. Time-course of the conditioning effect
(A): Time-course of the conditioning effect in a DPS experiment. Average CEPs for successive test stimuli delivered every 500 ms (top schematic). Red horizontal bars indicate segments of the CEP during which all samples are significantly different in the pre- vs post-conditioning comparison (p<0.001). The percentages give the degree of potentiation (positive) or depression (negative), quantified by the relative change in the CEP amplitude from the pre-conditioning level. (B): Time-course of conditioning effect in a HPS experiment. (C): Overall time-course of conditioning effect in all triggering sites. Panels show change in CEP amplitude (relative to pre-conditioning test stimulus) as a function of time after the last pulse of the conditioning burst. Dots connected by grey lines are measurements from single experimental sessions. Colored bars are the mean CEP change relative to the change at 500 ms post-conditioning for that time point, across all sessions (right axis). Red asterisks denote times at which CEP change, relative to pre-conditioning, was significantly different than 0, at the 0.05 significance level.
Figure 5.
Figure 5.. Conditioning effects in triggering and non-triggering sites
(A) Conditioning effect and stimulation phase at the triggering site. a: Effect of DPS conditioning. b: Stimulus-triggered average of raw ECoG (STA, blue) and sinusoidal fit (red line) compiled from conditioning stimuli, in a DPS experiment in monkey 1. Time 0 corresponds to the delivery of the conditioning stimulus. Oscillatory frequency was estimated by fitting a sinusoid to the STA; it was 18 Hz, with an R2 value of 0.92. c: Mean oscillatory phase at the time of stimulation, estimated from the STA, was 262 deg. d: Distribution of phases at the time of all individual conditioning stimuli in this session (instantaneous stimulation phases, ISPs); ISP values were estimated by fitting a sinusoid to individual sweeps preceding individual conditioning stimuli. The standard deviation (SD) of the ISP distribution is 58 deg. e (left): Distribution of estimated instantaneous frequency values, for all conditioning stimuli; average was 18 Hz. (right): Distribution of R2 values, indicating goodness of fit, for sinusoidal fit of individual sweeps. (B) Stimulation phase and conditioning effect at a non-triggering site. Rows and panels correspond to those in (A). The effect of conditioning on this site was smaller than that at the triggering site: CEP increased by 34%. The SD of the ISP distribution at this site (74 degrees) was larger than that at the triggering site. (C) Dependency of the conditioning effect on the SD of the ISP distribution at all triggering (filled symbols) and non-triggering sites (open symbols) in monkey 1 (red symbols) and monkey 2 (green symbols), separately for DPS (top panel) and HPS experiments (bottom panel). Conditioning effect is expressed as % CEP amplitude change. The colored lines represent the linear regression lines for animal 1 and animal 2 (red and green, respectively). In general, the larger the SD of the ISP distribution at a cortical site, the smaller the conditioning effect at that site (% CEP change approaches zero). Correlation coefficients between % CEP change and SD of ISP distribution in the DPS experiments were 0.61 and −0.79 for animal 1 and animal 2, respectively (p<0.01 in both cases), and in the HPS experiments 0.22 and 0.88 for animal 1 and animal 2, respectively (p=0.18 and p<0.01). See also figures S5 and S6.
Figure 6.
Figure 6.. Possible mechanisms for the conditioning effect
Schematic representation of 3 scenarios that could explain the conditioning effect. (A) Diagram of the cortical circuit undergoing conditioning: The triggering site (ST), from which oscillations are recorded, receives a cortical connection from the stimulated site (SS) manifesting as a cortically-evoked potential (CEP), shown with blue trace. A non-triggering site (SNT) also receives a connection from SS and undergoes oscillations in phase with those at ST. (B) Scenario 1: Stimulation of SS leads to stimulation phase- dependent change in the excitability of SS, in this case an increase with depolarizing phase stimulation (DPS). This would result in uniform relative change in the size of CEPs in both ST and SNT, since both CEPs are elicited by stimulation of a now more excitable SS. (C): Scenario 2: Stimulation of the SS leads to a change in the excitability of both ST and SNT dependent on stimulation phase- and distance. This would result in a larger change in the size of CEPs in the site that is closer to SS, because of current spread. (D): Scenario 3: Stimulation of the SS leads to phase-dependent modification of the connectivity from SS to both ST and SNT, consistent with spike-timing-dependent plasticity. This would result in a larger change in the size of CEPs at the ST than at the SNT, because of tighter correlation of the phase of oscillatory activity at ST with the stimulation-elicited volley from SS.

Comment in

Similar articles

Cited by

References

    1. Uhlhaas PJ, Roux F, Rodriguez E, Rotarska-Jagiela A, and Singer W (2010). Neural synchrony and the development of cortical networks. Trends in cognitive sciences 14, 72–80. - PubMed
    1. Sanes JN, and Donoghue JP (2000). Plasticity and primary motor cortex. Annual review of neuroscience 23, 393–415. - PubMed
    1. Nudo R (2014). Plasticity of cerebral motor functions: implications for repair and rehabilitation. In Textbook of Neural Repair and Rehabilitation, 2e, Volume 1, Selzer ME, Clarke S, Cohen LG, Kwakkel G and Miller RH, eds. (Cambridge, UK: Cambridge University Press; ), pp. 99–113.
    1. Feldman DE (2012). The spike-timing dependence of plasticity. Neuron 75, 556–571. - PMC - PubMed
    1. Donoghue JP, Sanes JN, Hatsopoulos NG, and Gaal G (1998). Neural discharge and local field potential oscillations in primate motor cortex during voluntary movements. Journal of neurophysiology 79, 159–173. - PubMed

Publication types