

Circular data in biology: advice for effectively implementing statistical procedures
- PMID: 30100666
- PMCID: PMC6060829
- DOI: 10.1007/s00265-018-2538-y
Circular data in biology: advice for effectively implementing statistical procedures
Abstract
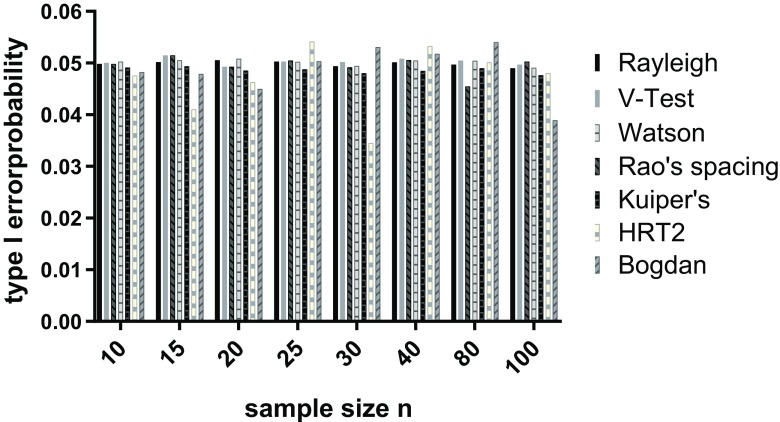
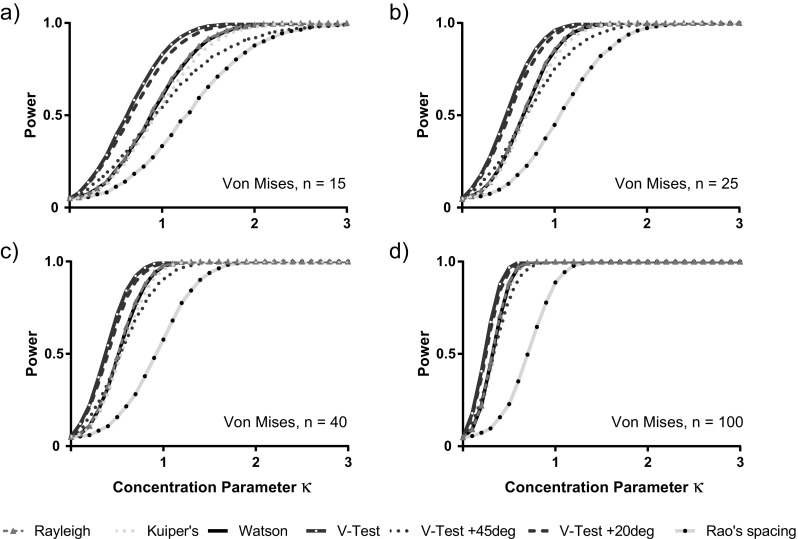
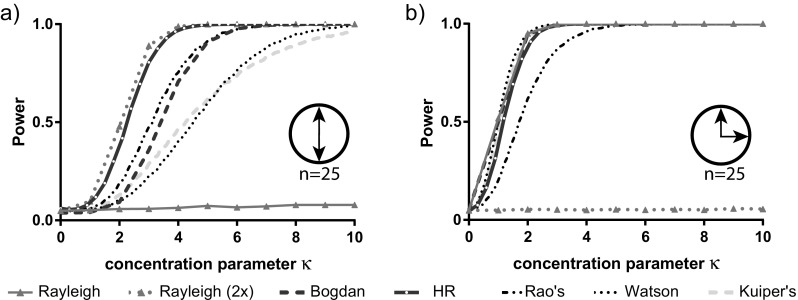
Circular data are common in biological studies. The most fundamental question that can be asked of a sample of circular data is whether it suggests that the underlying population is uniformly distributed around the circle, or whether it is concentrated around at least one preferred direction (e.g. a migratory goal or activity phase). We compared the statistical power of five commonly used tests (the Rayleigh test, the V-test, Watson's test, Kuiper's test and Rao's spacing test) across a range of different unimodal scenarios. The V-test showed higher power for symmetrical distributions, Rao's spacing performed worst for all explored unimodal distributions tested and the remaining three tests showed very similar performance. However, the V-test only applies if the hypothesis is restricted to one (pre-specified) direction of interest. In all other unimodal cases, we recommend using the Rayleigh test. Much less explored is the multimodal case with data concentrated around several directions. We performed power simulations for a variety of multimodal situations, testing the performance of the widely used Rayleigh, Rao's, Watson, and Kuiper's tests as well as the more recent Bogdan and Hermans-Rasson tests. Our analyses of alternative statistical methods show that the commonly used tests lack statistical power in many of multimodal cases. Transformation of the raw data (e.g. doubling the angles) can overcome some of the issues, but only in the case of perfect f-fold symmetry. However, the Hermans-Rasson method, which is not yet implemented in any software package, outcompetes the alternative tests (often by substantial margins) in most of the multimodal situations explored. We recommend the wider uptake of the powerful but hitherto neglected Hermans-Rasson method. In summary, we provide guidance for biologists helping them to make decisions when testing circular data for single or multiple departures from uniformity.
Keywords: Animal navigation; Biostatistics; Chronobiology; Circadian; Emlen funnel; Magnetoreception.
Conflict of interest statement
Compliance with ethical standardsThe authors declare that they have no competing interests.
Figures


Similar articles
-
The Hermans-Rasson test as a powerful alternative to the Rayleigh test for circular statistics in biology.BMC Ecol. 2019 Aug 7;19(1):30. doi: 10.1186/s12898-019-0246-8. BMC Ecol. 2019. PMID: 31391040 Free PMC article.
-
Grouped circular data in biology: advice for effectively implementing statistical procedures.Behav Ecol Sociobiol. 2020;74(8):100. doi: 10.1007/s00265-020-02881-6. Epub 2020 Jul 20. Behav Ecol Sociobiol. 2020. PMID: 32728310 Free PMC article.
-
Circular statistics meets practical limitations: a simulation-based Rao's spacing test for non-continuous data.Mov Ecol. 2019 May 10;7:15. doi: 10.1186/s40462-019-0160-x. eCollection 2019. Mov Ecol. 2019. PMID: 31110771 Free PMC article.
-
Detecting (non)parallel evolution in multidimensional spaces: angles, correlations and eigenanalysis.Biol Lett. 2022 Feb;18(2):20210638. doi: 10.1098/rsbl.2021.0638. Epub 2022 Feb 16. Biol Lett. 2022. PMID: 35168376 Free PMC article. Review.
-
[Aiming for zero blindness].Nippon Ganka Gakkai Zasshi. 2015 Mar;119(3):168-93; discussion 194. Nippon Ganka Gakkai Zasshi. 2015. PMID: 25854109 Review. Japanese.
Cited by
-
Harmonic radar tracking of individual melon flies, Zeugodacus cucurbitae, in Hawaii: Determining movement parameters in cage and field settings.PLoS One. 2022 Nov 16;17(11):e0276987. doi: 10.1371/journal.pone.0276987. eCollection 2022. PLoS One. 2022. PMID: 36383542 Free PMC article.
-
Directional Cell Migration Guided by a Strain Gradient.Small. 2024 Jan;20(4):e2302404. doi: 10.1002/smll.202302404. Epub 2023 Sep 22. Small. 2024. PMID: 37735983 Free PMC article.
-
Bumblebees increase their learning flight altitude in dense environments.J Exp Biol. 2025 May 1;228(9):jeb249714. doi: 10.1242/jeb.249714. Epub 2025 May 12. J Exp Biol. 2025. PMID: 40223735 Free PMC article.
-
The Hermans-Rasson test as a powerful alternative to the Rayleigh test for circular statistics in biology.BMC Ecol. 2019 Aug 7;19(1):30. doi: 10.1186/s12898-019-0246-8. BMC Ecol. 2019. PMID: 31391040 Free PMC article.
-
Human interictal epileptiform discharges are bidirectional traveling waves echoing ictal discharges.Elife. 2022 Jan 20;11:e73541. doi: 10.7554/eLife.73541. Elife. 2022. PMID: 35050851 Free PMC article.
References
-
- Agostinelli C, Lund U (2013) R package circular: Circular Statistics (version 0.43). https://r-forge.r-project.org/projects/circular
-
- Archibald AM, Bogdanov S, Patruno A, Hessels JWT, Deller AT, Bassa C, Janssen GH, Kaspi VM, Lyne AG, Stappers BW, Tendulkar SP, D’Angelo CR, Wijnands R. Accretion-powered pulsations in an apparently quiescent neutron star binary. Astrophys J. 2015;807:62. doi: 10.1088/0004-637X/807/1/62. - DOI
-
- Azzalini A. A class of distributions which includes the normal ones. Scand J Stat. 1985;12:171–178.
-
- Batschelet E. Circular statistics in biology. London: Academic press; 1981.
-
- Bergin TM. A comparison of goodness-of-fit tests for analysis of nest orientation in western kingbirds (Tyrannus verticalis) Condor. 1991;93:164–171. doi: 10.2307/1368619. - DOI
LinkOut - more resources
Full Text Sources
Other Literature Sources
Molecular Biology Databases