

A novel QTL associated with rice canopy temperature difference affects stomatal conductance and leaf photosynthesis
- PMID: 30100797
- PMCID: PMC6081301
- DOI: 10.1270/jsbbs.17129
A novel QTL associated with rice canopy temperature difference affects stomatal conductance and leaf photosynthesis
Abstract
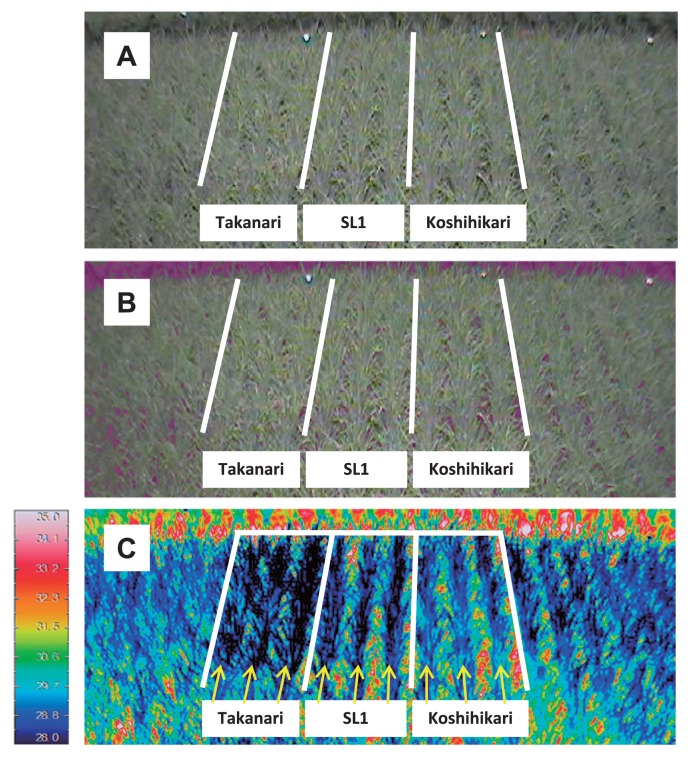
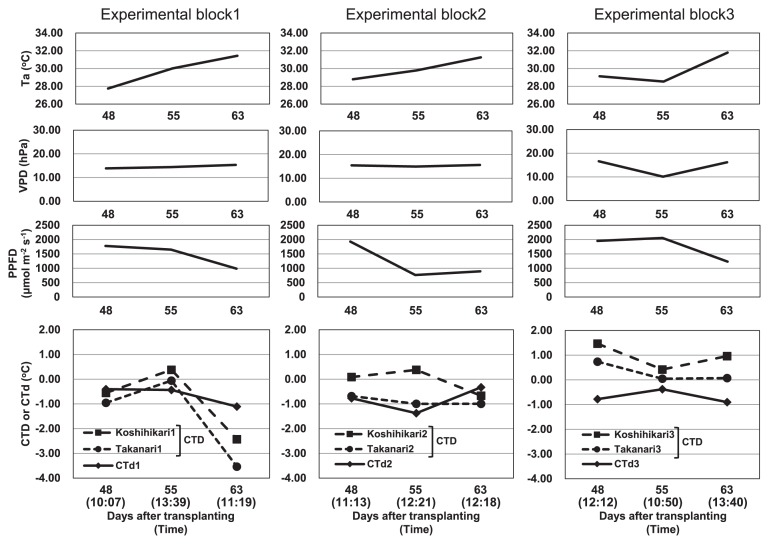
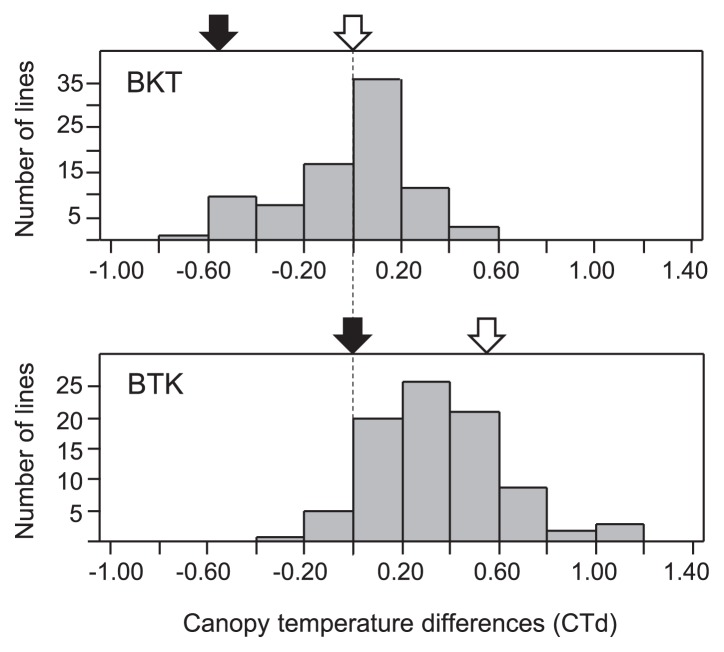
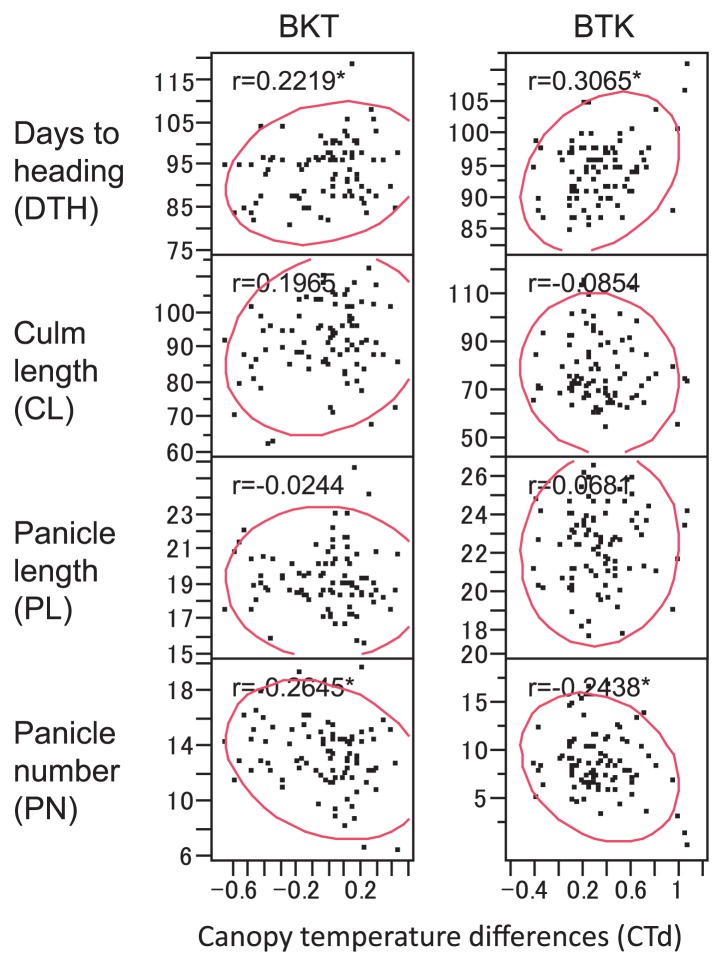
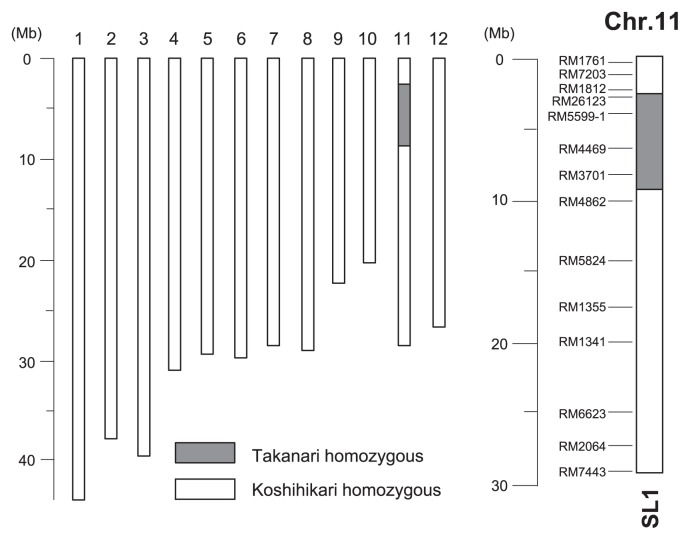
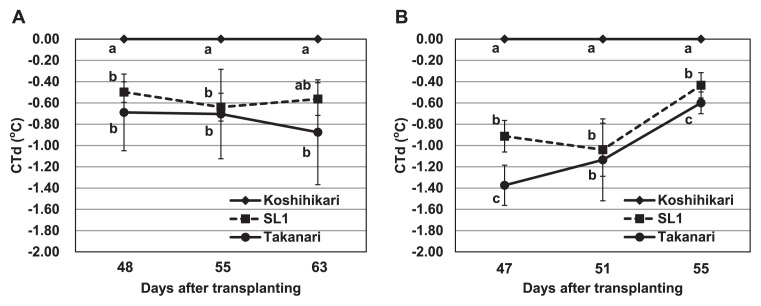
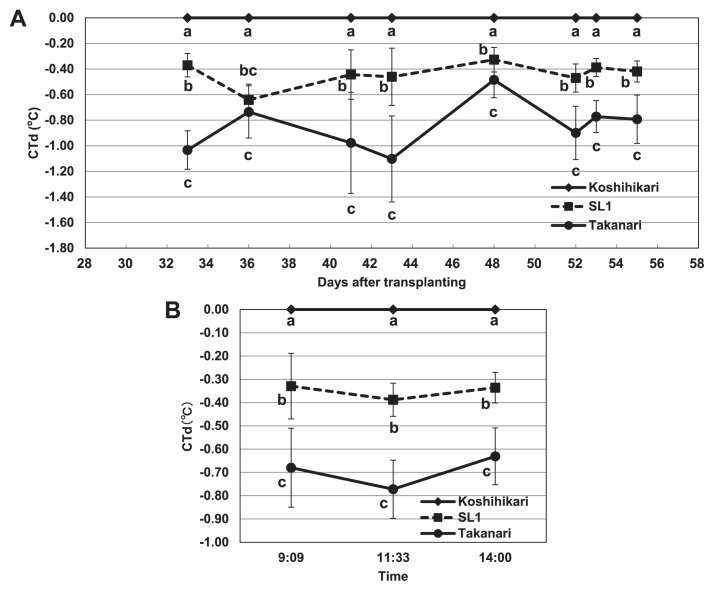
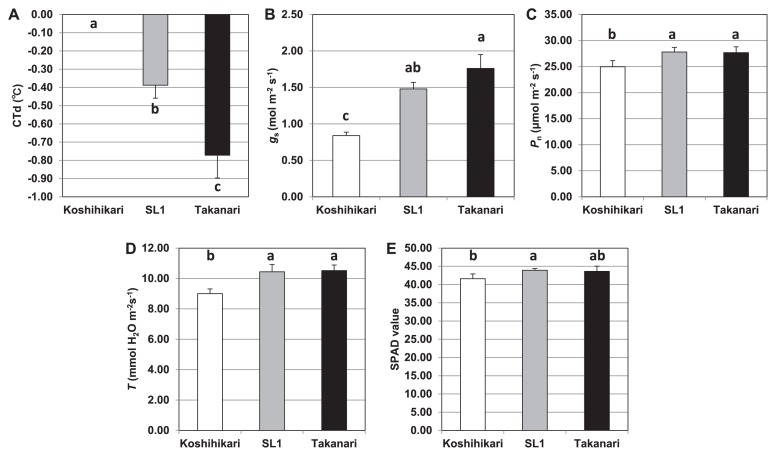
Canopy temperature can be a good indicator of stomatal conductance. To understand the genetic basis of phenotypic differences in stomatal conductance between average and high-yielding rice (Oryza sativa L.) cultivars, we conducted a quantitative trait locus (QTL) analysis of canopy temperature. We developed reciprocal series of backcross inbred lines (BC1F6) derived from a cross between the average-yielding japonica cultivar 'Koshihikari' and the high-yielding indica cultivar 'Takanari'. A stable QTL, qCTd11 (QTL for canopy temperature difference on chromosome 11) on the short arm of chromosome 11, accounted for 10.4 and 19.8% of the total phenotypic variance in the two lines; the 'Takanari' allele decreased the canopy temperature difference value. A chromosome segment substitution line carrying the Takanari qCTd11 showed a greater reduction in canopy temperature than 'Koshihikari', and had higher stomatal conductance and photosynthetic rate. These results suggest that qCTd11 is not only involved in canopy temperature, but is also involved in both stomatal conductance and photosynthetic rate.
Keywords: canopy temperature difference; chromosome segment substitution lines; photosynthetic rate; quantitative trait loci; rice (Oryza sativa); stomatal conductance.
Figures
Similar articles
-
Genetic architecture of leaf photosynthesis in rice revealed by different types of reciprocal mapping populations.J Exp Bot. 2019 Oct 15;70(19):5131-5144. doi: 10.1093/jxb/erz303. J Exp Bot. 2019. PMID: 31257428 Free PMC article.
-
Gene Pyramiding Strategies for Sink Size and Source Capacity for High-Yield Japonica Rice Breeding.Rice (N Y). 2025 Feb 13;18(1):6. doi: 10.1186/s12284-025-00756-w. Rice (N Y). 2025. PMID: 39945924 Free PMC article. Review.
-
Leaf photosynthetic rate and mesophyll cell anatomy changes during ontogenesis in backcrossed indica × japonica rice inbred lines.Photosynth Res. 2017 Oct;134(1):27-38. doi: 10.1007/s11120-017-0403-x. Epub 2017 May 24. Photosynth Res. 2017. PMID: 28540586
-
Increasing canopy photosynthesis in rice can be achieved without a large increase in water use-A model based on free-air CO2 enrichment.Glob Chang Biol. 2018 Mar;24(3):1321-1341. doi: 10.1111/gcb.13981. Epub 2017 Dec 15. Glob Chang Biol. 2018. PMID: 29136323
-
Genetic dissection of agronomically important traits in closely related temperate japonica rice cultivars.Breed Sci. 2017 Dec;67(5):427-434. doi: 10.1270/jsbbs.17053. Epub 2017 Nov 15. Breed Sci. 2017. PMID: 29398936 Free PMC article. Review.
Cited by
-
Selection strategies to introgress water deficit tolerance derived from Solanum galapagense accession LA1141 into cultivated tomato.Front Plant Sci. 2022 Jul 28;13:947538. doi: 10.3389/fpls.2022.947538. eCollection 2022. Front Plant Sci. 2022. PMID: 35968091 Free PMC article.
-
Breeding rice for a changing climate by improving adaptations to water saving technologies.Theor Appl Genet. 2022 Jan;135(1):17-33. doi: 10.1007/s00122-021-03899-8. Epub 2021 Jul 3. Theor Appl Genet. 2022. PMID: 34218290 Review.
-
Genetic architecture of leaf photosynthesis in rice revealed by different types of reciprocal mapping populations.J Exp Bot. 2019 Oct 15;70(19):5131-5144. doi: 10.1093/jxb/erz303. J Exp Bot. 2019. PMID: 31257428 Free PMC article.
-
Enhanced Leaf Cooling Is a Pathway to Heat Tolerance in Common Bean.Front Plant Sci. 2020 Feb 28;11:19. doi: 10.3389/fpls.2020.00019. eCollection 2020. Front Plant Sci. 2020. PMID: 32180776 Free PMC article.
-
Gene Pyramiding Strategies for Sink Size and Source Capacity for High-Yield Japonica Rice Breeding.Rice (N Y). 2025 Feb 13;18(1):6. doi: 10.1186/s12284-025-00756-w. Rice (N Y). 2025. PMID: 39945924 Free PMC article. Review.
References
-
- Ashikari, M., Sakakibara, H., Lin, S., Yamamoto, T., Takashi, T., Nishimura, A., Angeles, E.R., Qian, Q., Kitano, H. and Matsuoka, M. (2005) Cytokinin oxidase regulates rice grain production. Science 309: 741–745. - PubMed
-
- Babu, R.C., Nguyen, B.D., Chamarerk, V., Shanmugasundaram, P., Chezhian, P., Jeyaprakash, P., Ganesh, S.K., Palchamy, A., Sadasivam, S., Sarkarung, S.et al. (2003) Genetic analysis of drought resistance in rice by molecular markers. Crop Sci. 43: 1457–1469.
-
- Farquhar, G.D. and Sharkey, T.D. (1982) Stomatal conductance and photosynthesis. Annu. Rev. Plant Physiol. 33: 317–345.
-
- Fischer, R.A., Rees, D., Sayre, K.D., Lu, Z.-M., Condon, A.G. and Saavedra, A.L. (1998) Wheat yield progress associated with higher stomatal conductance and photosynthetic rate, and cooler canopies. Crop Sci. 38: 1467–1475.
LinkOut - more resources
Full Text Sources
Other Literature Sources