. 2018 Jul 13;9(54):30434-30449.
doi: 10.18632/oncotarget.25758.

cAMP-mediated autophagy inhibits DNA damage-induced death of leukemia cells independent of p53

Affiliations

cAMP-mediated autophagy inhibits DNA damage-induced death of leukemia cells independent of p53

Seham Skah et al. Oncotarget. .

Abstract

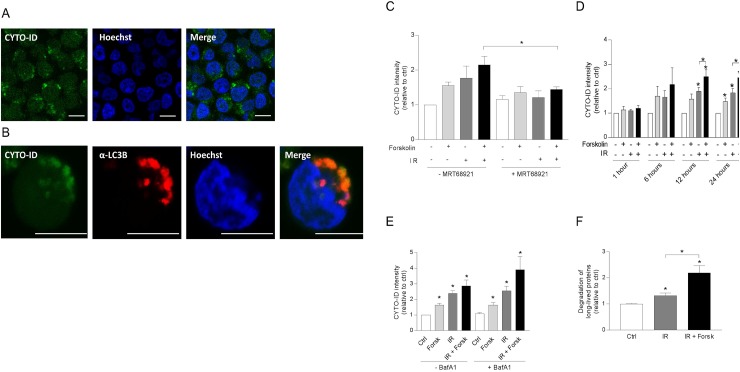
Autophagy is important in regulating the balance between cell death and survival, with the tumor suppressor p53 as one of the key components in this interplay. We have previously utilized an in vitro model of the most common form of childhood cancer, B cell precursor acute lymphoblastic leukemia (BCP-ALL), to show that activation of the cAMP signaling pathway inhibits p53-mediated apoptosis in response to DNA damage in both cell lines and primary leukemic cells. The present study reveals that cAMP-mediated survival of BCP-ALL cells exposed to DNA damaging agents, involves a critical and p53-independent enhancement of autophagy. Although autophagy generally is regarded as a survival mechanism, DNA damage-induced apoptosis has been linked both to enhanced and reduced levels of autophagy. Here we show that exposure of BCP-ALL cells to irradiation or cytotoxic drugs triggers autophagy and cell death in a p53-dependent manner. Stimulation of the cAMP signaling pathway further augments autophagy and inhibits the DNA damage-induced cell death concomitant with reduced nuclear levels of p53. Knocking-down the levels of p53 reduced the irradiation-induced autophagy and cell death, but had no effect on the cAMP-mediated autophagy. Moreover, prevention of autophagy by bafilomycin A1 or by the ULK-inhibitor MRT68921, diminished the protecting effect of cAMP signaling on DNA damage-induced cell death. Having previously proposed a role of the cAMP signaling pathway in development and treatment of BCP-ALLs, we here suggest that inhibitors of autophagy may improve current DNA damage-based therapy of BCP-ALL - independent of p53.

Keywords: DNA damage; apoptosis; autophagy; cAMP-signaling; p53.


Conflict of interest statement

CONFLICTS OF INTEREST The authors declare that there are no competing financial interests in relation to the work described.

Figures

Figure 1
Figure 1. cAMP signaling enhances the DNA damage-induced LC3-II/LC3-I ratio
(A and B) REH cells (0.6×10⁶ cells/ml) were incubated in the presence or absence of forskolin (Forsk, 60 μM) for 45 min prior to irradiation (IR, 10Gy), and total lysates were subjected to immunoblot analyses with antibodies against LC3B or calnexin (CANX). The numbers indicated below the LC3 images represent the LC3-II/LC3-I signal ratios relative to the CANX signals, normalized to the ratio in untreated (Ctrl) cells. (A) When indicated, BafA1 (2 nM) was added from the start of the cultures. The cells were harvested at the indicated time points after IR, and one representative Western blot of three is shown. (B) Left panel: The cells were harvested 24 hours after IR, and BafA1 (2 nM) was added for the last 4 hours, as indicated. One representative Western blot of 8 is shown. Right panel: Ratios of the LC3-II/LC3-I signal intensities relative to the CANX signals, normalized to ratio in untreated (Ctrl) cells. The data represent the mean +/- SEM, n=8. *p< 0.05 (paired t test).
Figure 2
Figure 2. PKA- and doxorubicin-mediated autophagy
(A and B) REH cells were treated with or without forskolin, IR and BafA1 as described in Figure 1B. When indicated, the cells were treated with or without 8CPT-cAMP (8CPT, 200μM) 45 min prior to IR (panel A) or with 150 nM doxorubicin (Doxo) 45 min after adding forskolin (panel B). Left panels: One representative Western blot of three independent experiments is shown. The numbers indicated below the LC3 images represent the LC3-II/LC3-I signal ratios relative to the CANX signals, normalized to the ratio in untreated (Ctrl) cells. Right panels: Ratios of the LC3-II/LC3-I signal intensities relative to the CANX signals, normalized to the ratio in untreated (Ctrl) cells. The data represent the mean +/- SEM, n=3. *p<0.05 (paired t test).
Figure 3
Figure 3. Immunocytochemistry of LC3-puncta
(A and B) REH cells were treated with or without forskolin, IR and BafA1 as described in Figure 1B, with addition of BafA1 to all samples. The cells were subjected to immunocytochemistry for the detection of LC3 puncta by confocal microscopy, and the cells were co-stained with Hoechst for visualization of the nuclei. (A) One representative of three independent experiments is shown. Scale bars = 10μm. (B) The number of LC3 puncta per cell from three independent experiments were quantified, counting at least 30 cells. The data represent the mean +/- SEM, n = 30. The numbers of small and large puncta are indicated.
Figure 4
Figure 4. cAMP signaling enhances autophagic flux in REH cells
(A-E) REH cells were treated with or without forskolin, IR and BafA1 as described in Figure 1B. CYTO-ID staining was performed 24 hours after IR – if not otherwise indicated, and the staining intensity was analyzed by flow cytometry and normalized to untreated (Ctrl) cells. (A) Confocal images of IR/forskolin-treated cells stained with CYTO-ID, (B) The co-localization between the autophagosomal marker CYTO-ID and LC3-puncta was analyzed by confocal imaging of IR/forskolin-treated cells. (C) The cells were pretreated with the ULK1 inhibitor MRT68921 (100 nM) for 30 min prior to adding forskolin, and the cells were irradiated after another 45 min. The data represent the mean CYTO-ID fluorescence intensity +/- SEM, n=3. *p=0.05 (paired t test). (D) The cells were stained with CYTO-ID at the indicated time points, and the fluorescence intensity was analyzed by flow cytometry. The data represent the mean CYTO-ID fluorescence intensity +/- SEM, n=5. *p<0.05 (paired t test). (E) Cells were treated with or without 2 nM BafA1for the last 4 hours of the 24 hours incubation. The data represent the mean CYTO-ID fluorescence intensity +/- SEM, n=5. *p<0.05 (paired t test). (F) The effect of IR and forskolin on relative autophagic flux was quantified by measuring the degradation of long-lived proteins as described in Materials and Methods. The data represent the mean +/- SEM, n=3, and the values are normalized to the degradation in untreated (Ctrl) cells. *p<0.05 (paired t test).
Figure 5
Figure 5. cAMP signaling enhances CYTO-ID staining in NALM-6 and in primary BCP-ALL cells
(A) NALM-6 cells (0.6×10⁶ cells/ml) were treated with or without forskolin (Forsk, 60μM) for 45 min prior to irradiation (IR, 5Gy). BafA1 (2 nM) was added to the cell cultures for the last 4 hours of the 24 hours incubation, before the cells were stained with CYTO-ID and analyzed for fluorescence intensity by flow cytometry. The data represent the mean CYTO-ID fluorescence intensity ± SEM, n=4. *p<0.05 (paired t test). (B) Primary leukemic blasts (0.6 x10⁶ cells/ml) from three patients diagnosed with BCP-ALL were treated with or without Forsk, IR and BafA1 as described in panel A.
Figure 6
Figure 6. cAMP-mediated inhibition of DNA damage-induced cell death involves autophagy
REH cells were treated with or without forskolin and irradiation as described in Figure 1. When indicated, BafA1 (2 nM) (A) or the ULK1 inhibitor MRT68921 (100 nM) (B) was present in the cell cultures throughout the experiments to block autophagy. The percentage of PI-positive cells was analyzed by flow cytometry 24 hours or 48 hours after IR, as indicated. The results are presented as the mean ± SEM, n=6. *p<0.05 (paired t test).
Figure 7
Figure 7. The effects of IR and cAMP signaling on the subcellular localization of p53
REH cells were treated with or without forskolin and IR as described in Figure 1. (A) 4 hours after IR, the cells were subjected to immunocytochemistry for the detection of the subcellular localization of p53 by confocal microscopy, and the cells were co-stained with Hoechst for the visualization of nuclei. One representative of three independent experiments is shown. Scale bars = 10μm. (B) Quantification of the p53 fluorescence intensity of cells from three experiments, analyzing at least 30 cells. The data represent the mean +/-SEM, n=30. *p<0.05, (paired t test). (C) Subcellular fractionation of REH cells (20×106) was performed as described in Materials and Methods 4 hours after IR. The cytoplasmic and nuclear fractions were each subjected to immunoblot analyses of p53 expression. The numbers indicated below the p53 image represents the p53 signal intensity relative to the CANX signal, normalized to the ratio in untreated (Ctrl) cells. Left panel: One of three representative Western blots. Right panel: Quantification of the p53 signal in Western blots, normalized to the loading control GAPDH. The data represent the mean +/-SEM, n=3. *p<0.05 (paired t test).
Figure 8
Figure 8. p53 is involved in IR-, but not in cAMP-induced autophagy
(A-D) REH cells (4×10⁶ cells) were transfected with siRNA against p53 (or with scrambled siRNA as control) as described in Materials and Methods, and after 12 hours the cells were treated with or without forskolin and IR as described in Figure 1. (A) Knock-down of p53 by siRNA demonstrated by Western blot analyses of untreated (Ctrl) and irradiated (IR) cells. Signal intensities of p53 relative to GAPDH, normalized to Ctrl, are indicated as numbers below the p53 images. (B-D) BafA1 (2 nM) was added for the last 4 hours of the 24 hours incubations. (B) 24 hours after IR, the cells were harvested for Western blot analyses of LC3-II/I ratios, and one representative of 4 independent experiments is shown. The numbers indicated below the LC3 images represent the LC3-II/LC3-I signal ratios relative to the CANX signals, normalized to the ratio in untreated (Ctrl) cells. (C) Quantifications of the Western blots in panel B, presented as the ratios of LC3-II/LC3-I signal intensities relative to the CANX signals, normalized to the ratio in untreated (Ctrl) cells. The data represent the mean +/- SEM, n=4. *p<0.05 (paired t test). (D) The same cells as in panel A were subjected to CYTO-ID staining, and the fluorescence intensity was analysed by flow cytometry 24 hours after IR. The data represent the mean CYTO-ID fluorescence intensity +/- SEM, n=4. *p<0.05 (paired t test).
Figure 9
Figure 9. Proposed model for cAMP-mediated survival of DNA damage-induced BCP-ALL cells
According to the model, cAMP-mediated survival of BCP-ALL cells exposed to DNA damage involves reduced p53-mediated apoptosis as well as p53-independent enhancement of autophagy. We suggest that autophagy needs to exceed a certain threshold in order to let the cells survive exposure to DNA damaging agents.

Similar articles

Cited by

References

    1. Galluzzi L, Pietrocola F, Bravo-San Pedro JM, Amaravadi RK, Baehrecke EH, Cecconi F, Codogno P, Debnath J, Gewirtz DA, Karantza V, Kimmelman A, Kumar S, Levine B, et al. Autophagy in malignant transformation and cancer progression. EMBO J. 2015;34:856–80. https://doi.org/10.15252/embj.201490784. - DOI - PMC - PubMed
    1. Amaravadi R, Kimmelman AC, White E. Recent insights into the function of autophagy in cancer. Genes Dev. 2016;30:1913–30. doi: 10.1101/gad.287524.116. - DOI - PMC - PubMed
    1. Galluzzi L, Bravo-San Pedro JM, Kroemer G. Defective Autophagy Initiates Malignant Transformation. Mol Cell. 2016;62:473–4. doi: 10.1016/j.molcel.2016.05.001. - DOI - PubMed
    1. Chen C, Lu L, Yan S, Yi H, Yao H, Wu D, He G, Tao X, Deng X. Autophagy and doxorubicin resistance in cancer. Anticancer Drugs. 2018;29:1–9. - PubMed
    1. Klionsky DJ. Autophagy: from phenomenology to molecular understanding in less than a decade. Nat Rev Mol Cell Biol. 2007;8:931–7. doi: 10.1038/nrm2245. - DOI - PubMed