. 2018 Aug 8;4(8):eaat4985.
doi: 10.1126/sciadv.aat4985. eCollection 2018 Aug.

Tousled-like kinases stabilize replication forks and show synthetic lethality with checkpoint and PARP inhibitors

Affiliations

Tousled-like kinases stabilize replication forks and show synthetic lethality with checkpoint and PARP inhibitors

Sung-Bau Lee et al. Sci Adv. .

Abstract

DNA sequence and epigenetic information embedded in chromatin must be faithfully duplicated and transmitted to daughter cells during cell division. However, how chromatin assembly and DNA replication are integrated remains unclear. We examined the contribution of the Tousled-like kinases 1 and 2 (TLK1/TLK2) to chromatin assembly and maintenance of replication fork integrity. We show that TLK activity is required for DNA replication and replication-coupled nucleosome assembly and that lack of TLK activity leads to replication fork stalling and the accumulation of single-stranded DNA, a phenotype distinct from ASF1 depletion. Consistent with these results, sustained TLK depletion gives rise to replication-dependent DNA damage and p53-dependent cell cycle arrest in G1. We find that deficient replication-coupled de novo nucleosome assembly renders replication forks unstable and highly dependent on the ATR and CHK1 checkpoint kinases, as well as poly(adenosine 5'-diphosphate-ribose) polymerase (PARP) activity, to avoid collapse. Human cancer data revealed frequent up-regulation of TLK genes and an association with poor patient outcome in multiple types of cancer, and depletion of TLK activity leads to increased replication stress and DNA damage in a panel of cancer cells. Our results reveal a critical role for TLKs in chromatin replication and suppression of replication stress and identify a synergistic lethal relationship with checkpoint signaling and PARP that could be exploited in treatment of a broad range of cancers.


Figures

Fig. 1
Fig. 1. TLK2 is required for efficient DNA replication.
(A) U-2-OS cells were pulsed with BrdU 48 hours after transfection with siRNAs against TLK1 or TLK2. The percentage of S-phase cells was subsequently quantified by analysis of DNA content using propidium iodide (PI) and staining for BrdU. Means and SD from technical replicates performed in at least biological duplicate are shown. (B) The percentage of S-phase cells was quantified in MDA-MB-231 cells pulsed with BrdU 72 hours after transfection and analyzed as in (A). (C) Western blot analysis of TLK1 and TLK2 from whole-cell lysates of U-2-OS (top) or MDA-MB-231 cells (bottom) 48 or 72 hours after siRNA transfection, respectively. (D) Immunofluorescence analysis of EdU incorporation in U-2-OS cells pulsed with EdU 30 hours after TLK2 siRNA transfection. Representative images are shown with PCNA as a marker for S-phase cells. (E) DNA replication in complemented U-2-OS cells. U-2-OS cells stably expressing siRNA-resistant WT or KD TLK2 were analyzed as in (D). See fig. S1F for Western blots for TLK2-WT or KD. EdU average intensities relative to parental cells from n = 3 independent biological replicates are shown with means and SD. One-sample and unpaired two-tailed t tests were used for statistical analysis of parental U-2-OS cells and complemented cell lines (TLK2WT and KD), respectively. **P < 0.01; n.s., not significant; a.u., arbitrary units. (F) Analysis of replication fork speed by DNA combing analysis. Length of CldU-labeled tracks (n > 250) was measured. One representative experiment of two biological replicates is shown, and median is indicated by a red line. (G) Analysis of replication factor chromatin loading in U-2-OS cells treated with or without UCN-01 30 hours after transfection. Cells were preextracted, and the chromatin pellet was subjected to Western blotting. One representative experiment of two biological replicates is shown.
Fig. 2
Fig. 2. TLK2 is required for replication-coupled chromatin assembly.
(A) Experimental design for assaying histone incorporation in cell lines stably expressing SNAP-tag histones H3.1 and H3.3. For quench (Q)–chase–pulse (P) experiments, U-2-OS cells were pulsed with SNAP-Block, chased for 7 hours, and then pulsed with TMR-Star. IF, immunofluorescence. (B) Quantification of SNAP-tag histone incorporation from n = 3 (H3.1) and n = 2 (H3.3) independent experiments as described in (A). Tetramethylrhodamine (TMR) intensity relative to mock-transfected cells is plotted. For each data point, n > 300 nuclei were analyzed. Means and SEM are indicated. For H3.1, a two-tailed t test was used for statistical analysis (*P < 0.05). (C) Western blot analysis of whole-cell lysates of U-2-OS cells stably expressing SNAP-tag histones 48 hours after siRNA transfection. (D) Representative images of TMR signal in H3.1- and H3.3-SNAP–expressing U-2-OS cell lines. 4′,6-Diamidino-2-phenylindole (DAPI) and RPA staining are also shown. (E) Experimental design of chromatin assembly assay measuring resistance to MNase digestion of nascent chromatin relative to bulk chromatin. (F) Nascent chromatin assembly analyzed as in (E) in U-2-OS cells transfected with the indicated siRNAs for 30 hours. One representative experiment of n = 3 biological replicates is shown. siRNA against FLASH that inhibits new histone biosynthesis and was included as a positive control.
Fig. 3
Fig. 3. Loss of TLK activity leads to DNA unwinding, accumulation of DNA damage, and loss of viability.
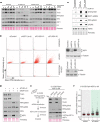
(A) Immunofluorescence analysis of MDA-MB-231 cells costained with antibodies against RPA, γH2AX, and DAPI. (B) High-throughput microscopy (HTM) analysis of chromatin-bound RPA in parental MDA-MB-231 (WT) or TLK1-null cells (TLK1Δ) 72 hours after siRNA transfection. One representative experiment of n = 3 biological replicates is shown; median is indicated in red. After normalization to siCont (WT) average, one-sample t test was used for statistical analysis of n = 3 independent experiments: significance of P = 0.1475 was observed for siTLK2#1 (WT), **P = 0.0015 for siTLK2#2 (WT), P = 0.0917 for siTLK2#1 (TLK1Δ), and **P = 0.0014 for siTLK2#2 (TLK1Δ) relative to siCont (WT). Differences between siCont (TLK1Δ) and siCont (WT) were not significant. (C) Quantification of the MDA-MB-231 cells with more than five RPA foci. At least 300 nuclei were analyzed, and the mean with SEM is shown for independent cultures (n = 10 for siCont; n = 6 for siTLK2). An unpaired two-tailed t test was used for statistical analysis. *P < 0.05, ***P < 0.001. (D) HTM analysis of the chromatin-bound RPA in U-2-OS cells 48 hours after siRNA transfection. One representative experiment of n = 6 biological replicates is shown; median is indicated in red. After normalization to siCont average, one-sample t test was used for statistical analysis of at least n = 6 independent experiments: significance of P = 0.0514 was observed for siTLK1, P = 0.0005 for siTLK2, and P = 0.0120 for siTLK1+2. (E and F) Analysis of replication stress response in U-2-OS cells transfected with TLK2 siRNAs alone or together with CDC45 siRNAs for 30 hours (E) or 48 hours (F). One representative experiment of two biological replicates is shown for (E) and (F). (G) Colony formation assay in U-2-OS cells transfected with TLK siRNAs. Data represent means and SEM of biological replicates (n = 5 for siCont, n = 4 for siTLK2#1, and n = 2 for siTLK2#2), each done at least in technical duplicates. A one-sample t test was used for statistical analysis. ***P = 0.0001 for siTLK2#1 and *P = 0.0324 for siTLK2#2. (H) Western blot analysis of U-2-OS cell lysates after 48 hours of siRNA transfection, representative of three independent experiments. (I) Cell cycle progression analyzed by flow cytometry of cells treated with nocodazole and stained with PI. The experimental design (left) and representative cell cycle profiles (right) from one of n = 3 biological replicates are shown.
Fig. 4
Fig. 4. TLK depletion causes genomic instability and sensitizes cells to checkpoint inactivation and PARP inhibition.
(A) Analysis of DNA damage signaling in U-2-OS cells 24 hours after siRNA transfection and treatment with or without UCN-01 for 2 hours. One representative experiment of three biological replicates is shown. (B) HTM analysis of RPA accumulation and γH2AX in TLK2-depleted U-2-OS cells treated with UCN-01 alone or together with roscovitine for 2 hours. One representative experiment of two biological replicates is shown (n > 1800). (C) PFGE analysis of DNA DSBs in U-2-OS cells transfected with siRNAs for 24 hours and treated with UCN-01 for 4 hours. Representative result (left) and quantification (right) of DNA breaks relative to untreated control from n = 3 independent experiments are shown with the means and SD. An unpaired two-tailed t test was used for statistical analysis. **P < 0.01. IR, ionizing radiation, 20 Gy. (D) Sensitivity of TLK-depleted cells to the CHK1 inhibitor AZD7762 measured by colony formation assay. Representative experiment of two biological replicates performed in technical duplicate is shown. (E) Sensitivity to PARP inhibitor olaparib measured by colony formation assay; representative images are shown. Means and range of two biological replicates performed in technical duplicate are shown. (F) Western blotting of RPA and phospho-RPA following TLK depletion and olaparib treatment in U-2-OS cells.
Fig. 5
Fig. 5. Defects in new histone deposition are synthetic lethal with checkpoint inhibition.
(A) Time course Western blot analysis of replication stress signaling following the siRNA depletion of TLK1/2, ASF1a/b, and FLASH in U-2-OS cells. (B) Analysis of DNA damage signaling in U-2-OS cells treated with siRNAs and UCN-01 for 24 and 2 hours, respectively. One representative experiment of two biological replicates is shown. (C) HTM analysis of RPA accumulation and γH2AX in ASF1a/b or FLASH-depleted U-2-OS cells as in Fig. 4B (left). Western blot controls for siRNA treatment (right). One representative experiment of two biological replicates is shown (n > 4800). (D) Western blot analysis of replication stress signaling following the siRNA depletion of the indicated combinations of TLK1/2 and ASF1a/b in U-2-OS cells. One representative experiment of three biological replicates is shown. (E) Schematic of the experiment (left). FlpIn-ASF1a-4A U-2-OS cells were induced with tetracycline for 24 hours following transfection with siRNA against TLK2, and indicated proteins were monitored by Western blotting (right). One representative experiment of four biological replicates is shown. (F) HTM analysis of the nuclear intensity of γH2AX was measured in ASF1 4A cells. Representative results from one representative experiment of three biological replicates performed are shown. After normalization to siCont (−Tet) average, one-sample t test was used for statistical analysis of n = 3 independent experiments: significance of P = 0.0266 was observed for siTLK2 (−Tet) and P = 0.0011 for siTLK2 (+Tet). In addition, a two-tailed unpaired t test was performed between siTLK2 (−Tet) and siTLK2 (+Tet), and P = 0.0484 was observed.
Fig. 6
Fig. 6. TLKs are amplified and suppress replication stress in multiple cancer types.
(A) Box plots of the fraction of patients with CNIs or CNDs among the TCGA cohorts (details in table S1) for the indicated genes. Box plots show first to third quartiles, with whiskers at third quartile +1.5*IQR (interquartile range) and first quartile −1.5*IQR. Analysis of mutation frequency for the same genes is provided in fig. S5A. (B) Heat map showing the percentage of samples in individual TCGA cohorts with CNIs for the indicated gene. TCGA cohort abbreviations and chromosome locations of each gene are provided in tables S1 and S2, and heat maps for CNDs and mutations are provided in fig. S5 (B and C). (C to E) Kaplan-Meier plots of multivariate disease-free survival analysis of the TCGA uveal melanoma (uvm; D), cervical squamous cell carcinoma and endocervical adenocarcinoma (cesc; E), and cervical kidney renal papillary cell carcinoma (kirp; F) cohorts based on the expression of the indicated gene. The hazard ratios (HR) and [likelihood ratio test (LRT)] P values were calculated using expression as a continuous variable: uvm (low, n = 30; high, n = 29), HR = 3.29 (1.44 to 7.53) for TLK1(LRT-pv = 0.0007744) and HR = 2.52 (1.19 to 5.35) for TLK2(LRT-pv = 0.0064077); cesc (low and high, n = 84), HR = 1.49 (1.04 to 2.12) for TLK1(LRT-pv = 0.031458) and HR = 1.45 (1.06 to 1.97) for TLK2(LRT-pv = 0.028423); kirp (low, n = 112; high, n = 110), HR = 0.80 (0.58 to 1.11) for TLK1(LRT-pv = 0.17713) and HR = 1.28 (0.99 to 1.66) for TLK2(LRT-pv = 0.075713). Additional supporting data are provided in tables S4 and S5. (F) HTM analysis of γH2AX 48 hours after siRNA treatment in the indicated cell line. One representative experiment of two biological replicates is shown. Median is indicated by a red line. (G) Representative image examples for the quantification in (F). Staining for γH2AX and TLK1 (to assess depletion levels) is shown. A minimum of 150 nuclei were evaluated for each cell line in each experiment. (H) Model for the combined influence of chromatin assembly and checkpoint signaling in the protection of stalled replication forks. Assembly of new nucleosomes on replicating DNA is required for fork progression and is dependent on ASF1-mediated histone provision. Reduced TLK activity impairs de novo nucleosome assembly, slowing down replication forks and reducing their stability. Under these circumstances, basal checkpoint and PARP activity are required to maintain the stability of stalled forks and prevent new origin firing that would accelerate fork collapse and increase levels of DNA damage.

Similar articles

Cited by

References

    1. Zeman M. K., Cimprich K. A., Causes and consequences of replication stress. Nat. Cell Biol. 16, 2–9 (2014). - PMC - PubMed
    1. Bryant H. E., Petermann E., Schultz N., Jemth A.-S., Loseva O., Issaeva N., Johansson F., Fernandez S., McGlynn P., Helleday T., PARP is activated at stalled forks to mediate Mre11-dependent replication restart and recombination. EMBO J. 28, 2601–2615 (2009). - PMC - PubMed
    1. Min W., Bruhn C., Grigaravicius P., Zhou Z.-W., Li F., Krüger A., Siddeek B., Greulich K.-O., Popp O., Meisezahl C., Calkhoven C. F., Bürkle A., Xu X., Wang Z.-Q., Poly(ADP-ribose) binding to Chk1 at stalled replication forks is required for S-phase checkpoint activation. Nat. Commun. 4, 2993 (2013). - PubMed
    1. Alabert C., Groth A., Chromatin replication and epigenome maintenance. Nat. Rev. Mol. Cell Biol. 13, 153–167 (2012). - PubMed
    1. Mejlvang J., Feng Y., Alabert C., Neelsen K. J., Jasencakova Z., Zhao X., Lees M., Sandelin A., Pasero P., Lopes M., Groth A., New histone supply regulates replication fork speed and PCNA unloading. J. Cell Biol. 204, 29–43 (2014). - PMC - PubMed

Publication types

MeSH terms

LinkOut - more resources