. 2018 Sep 1;141(9):2619-2630.
doi: 10.1093/brain/awy210.

Epilepsyecosystem.org: crowd-sourcing reproducible seizure prediction with long-term human intracranial EEG

Affiliations

Epilepsyecosystem.org: crowd-sourcing reproducible seizure prediction with long-term human intracranial EEG

Levin Kuhlmann et al. Brain. .

Abstract

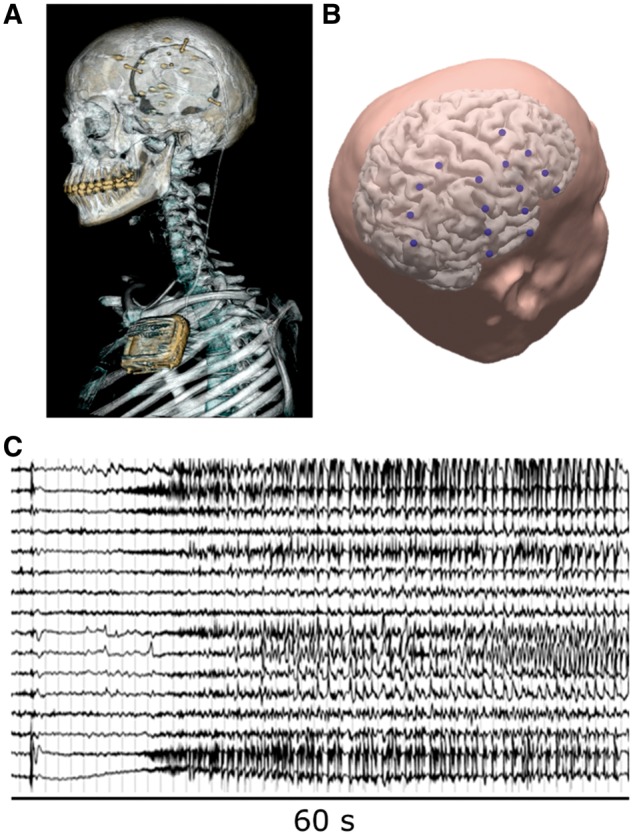
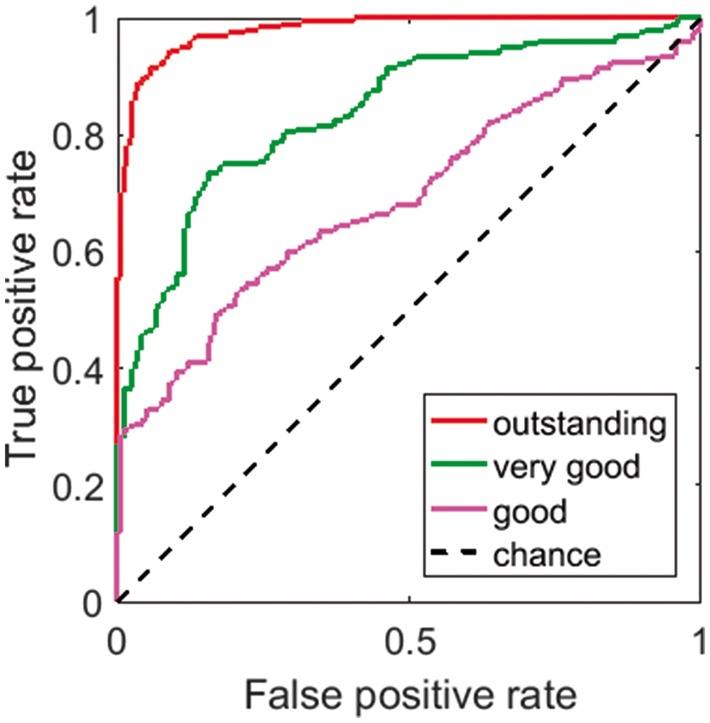
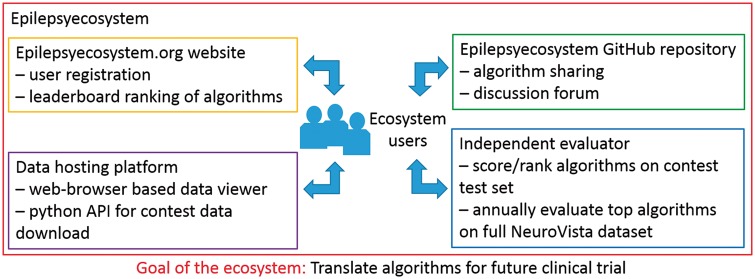
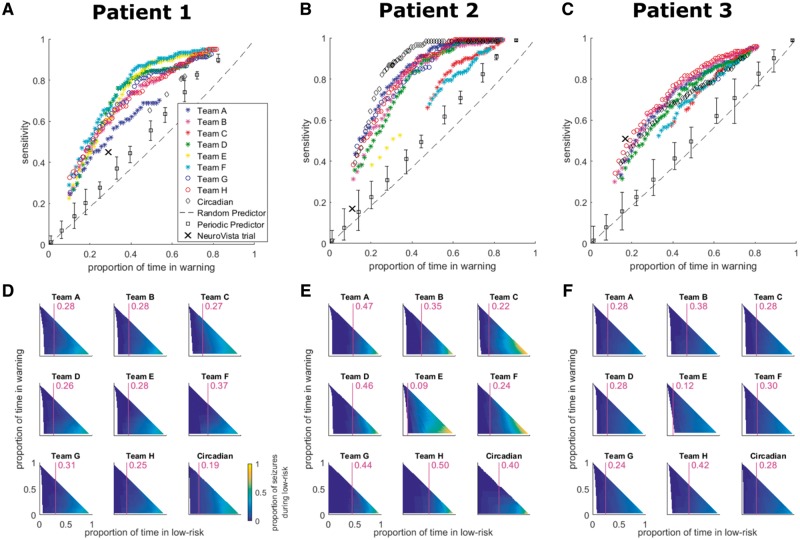
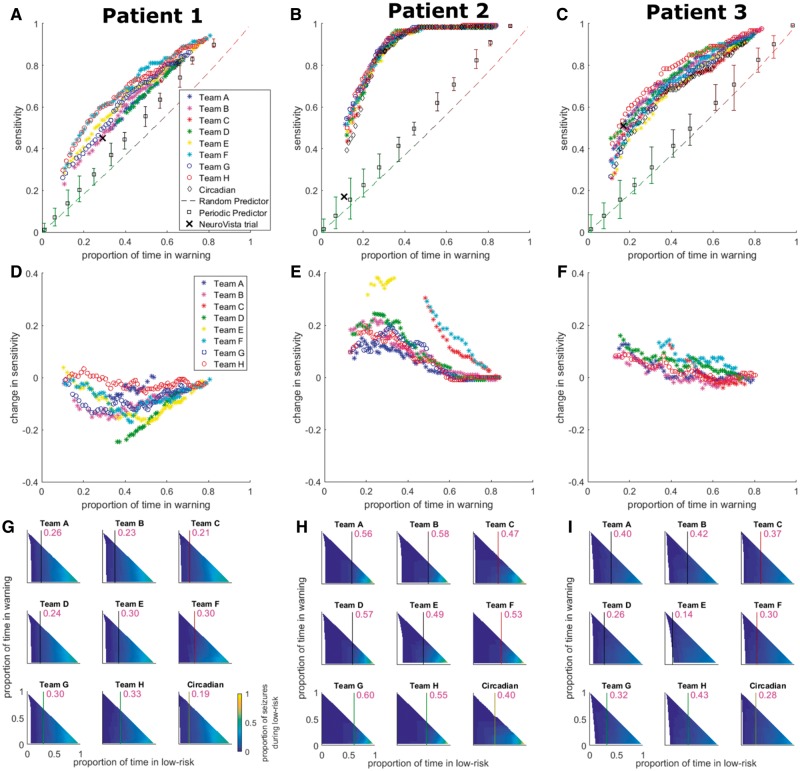
Accurate seizure prediction will transform epilepsy management by offering warnings to patients or triggering interventions. However, state-of-the-art algorithm design relies on accessing adequate long-term data. Crowd-sourcing ecosystems leverage quality data to enable cost-effective, rapid development of predictive algorithms. A crowd-sourcing ecosystem for seizure prediction is presented involving an international competition, a follow-up held-out data evaluation, and an online platform, Epilepsyecosystem.org, for yielding further improvements in prediction performance. Crowd-sourced algorithms were obtained via the 'Melbourne-University AES-MathWorks-NIH Seizure Prediction Challenge' conducted at kaggle.com. Long-term continuous intracranial electroencephalography (iEEG) data (442 days of recordings and 211 lead seizures per patient) from prediction-resistant patients who had the lowest seizure prediction performances from the NeuroVista Seizure Advisory System clinical trial were analysed. Contestants (646 individuals in 478 teams) from around the world developed algorithms to distinguish between 10-min inter-seizure versus pre-seizure data clips. Over 10 000 algorithms were submitted. The top algorithms as determined by using the contest data were evaluated on a much larger held-out dataset. The data and top algorithms are available online for further investigation and development. The top performing contest entry scored 0.81 area under the classification curve. The performance reduced by only 6.7% on held-out data. Many other teams also showed high prediction reproducibility. Pseudo-prospective evaluation demonstrated that many algorithms, when used alone or weighted by circadian information, performed better than the benchmarks, including an average increase in sensitivity of 1.9 times the original clinical trial sensitivity for matched time in warning. These results indicate that clinically-relevant seizure prediction is possible in a wider range of patients than previously thought possible. Moreover, different algorithms performed best for different patients, supporting the use of patient-specific algorithms and long-term monitoring. The crowd-sourcing ecosystem for seizure prediction will enable further worldwide community study of the data to yield greater improvements in prediction performance by way of competition, collaboration and synergism.10.1093/brain/awy210_video1awy210media15817489051001.


Figures

Figure 1
Figure 1
The NeuroVista seizure advisory system. (A) Example CT scan of the NeuroVista seizure advisory system implanted in a patient. (B) Imaging reconstruction showing example locations of electrodes (blue) used by the implant to record iEEG. (C) An example seizure recorded with the 16-channel device.
Figure 2
Figure 2
AUC-based evaluation of seizure prediction algorithms. The performance of algorithms can be assessed through ROC curves that plot true positive rates versus false positive rates and computing the AUC to quantify performance. A perfect predictor has an AUC of 1. True positive rates refer to the proportion of preictal data clips correctly classified and false positive rates refer to the proportion of interictal data clips incorrectly classified as preictal. In this paper, each algorithm provides a preictal probability for each data clip and a threshold applied to a given preictal probability is used to determine if the algorithm predicts that the corresponding segment is preictal or interictal. This is determined for all data clips. Different threshold values give rise to different points on the ROC curve. The legend and coloured lines indicate example performance levels of different algorithms.
Figure 3
Figure 3
A schematic illustration of the main features of Epilepsyecosystem.org.
Figure 4
Figure 4
Pseudo-prospective seizure prediction results for the held-out data. (AC) Seizure prediction performances for Patients 1–3, respectively, for all competition teams considered in the held-out evaluation. The results are compared to circadian, periodic, and random prediction, and to the original NeuroVista trial performance. The y- and x-axes correspond to sensitivity and proportion of time in warning (i.e. time in ‘red light’ or high-seizure-risk), respectively. For the different teams, data points correspond to different preictal probability thresholds and only data points surviving correction for multiple comparisons are plotted. The legend in A applies to AC with teams listed in descending rank on the private leader board. Error bars for the periodic predictor indicate the ranges of performance over all phases. (DF) Low-seizure-risk advisory performance for Patients 1–3, respectively, for all teams considered in the held-out evaluation as well as circadian prediction. The y- and x-axes correspond to proportion of time in warning and proportion of time in low-risk (i.e. time in ‘blue light’), respectively. The colour bar in D indicates the proportion of seizures occurring during low risk and applies to DF. The purple vertical lines and numerical values overlaid on the subplots in DF provide, for a proportion of time in warning of 0.25, the maximum proportion of time in low-risk for which the proportion of seizures occurring in low-risk is at most 0.05.
Figure 5
Figure 5
Pseudo-prospective circadian-weighted seizure prediction results for the held-out data. (AC) Circadian-weighted seizure prediction performances for Patients 1–3, respectively, for all competition teams considered in the held-out evaluation. The results are compared to circadian, periodic, and random prediction, and to the original NeuroVista trial performance. The y- and x-axes correspond to sensitivity and proportion of time in warning (i.e. time in ‘red-light’ or high-seizure-risk), respectively. For the different teams, data points correspond to different preictal probability thresholds and only data points surviving correction for multiple comparisons are plotted. The legend in A applies to AC with teams listed in descending rank on the private leaderboard. Error bars for the periodic predictor indicate the ranges of performance over all phases. (DF) Change in held-out data performance when subtracting sensitivity of the original algorithms from the sensitivity of the circadian-weighted algorithms for Patients 1–3, respectively. The y- and x-axes correspond to change in sensitivity (positive/negative change indicates an increase/decrease in performance when adding circadian-weighting) and proportion of time in warning, respectively. The legend in D applies to DF. (GI) Low-seizure-risk advisory performance for Patients 1–3, respectively, for all circadian-weighted algorithms (i.e. teams) considered in the held-out evaluation as well as circadian prediction. The y- and x-axes correspond to proportion of time in warning and proportion of time in low-risk (i.e. time in ‘blue-light’), respectively. The colour bar in G indicates the proportion of seizures occurring during low risk and applies to GI. The purple vertical lines and numerical values overlaid on the subplots in GI provide, for a proportion of time in warning of 0.25, the maximum proportion of time in low-risk for which the proportion of seizures occurring in low-risk is at most 0.05.

References

    1. Barachant A, Bonnet S, Congedo M, Jutten C. Classification of covariance matrices using a Riemannian-based kernel for BCI applications. Neurocomputing 2013; 112: 172–8.
    1. Baud MO, Kleen JK, Mirro EA, Andrechak JC, King-Stephens D, Chang EF et al. . Multi-day rhythms modulate seizure risk in epilepsy. Nat Commun 2018; 9: 88. - PMC - PubMed
    1. Brinkmann BH, Wagenaar J, Abbot D, Adkins P, Bosshard SC, Chen M et al. . Crowdsourcing reproducible seizure forecasting in human and canine epilepsy. Brain 2016; 139 (Pt 6): 1713–22. - PMC - PubMed
    1. Chen T, Guestrin C. Xgboost: A scalable tree boosting system. In: Proceedings of the 22nd ACM SIGKDD International Conference on Knowledge Discovery and Data Mining; 2016. ACM; 2016; p. 785–94.
    1. Congedo M, Barachant A, Bhatia R. Riemannian geometry for EEG-based brain-computer interfaces; a primer and a review. Brain-Computer Interfaces 2017; 4: 155–174.

Publication types