

Effects of Omitting Non-confounding Predictors From General Relative-Risk Models for Binary Outcomes
- PMID: 30101814
- PMCID: PMC6375815
- DOI: 10.2188/jea.JE20170226
Effects of Omitting Non-confounding Predictors From General Relative-Risk Models for Binary Outcomes
Abstract
Background: The effects, in terms of bias and precision, of omitting non-confounding predictive covariates from generalized linear models have been well studied, and it is known that such omission results in attenuation bias but increased precision with logistic regression. However, many epidemiologic risk analyses utilize alternative models that are not based on a linear predictor, and the effect of omitting non-confounding predictive covariates from such models has not been characterized.
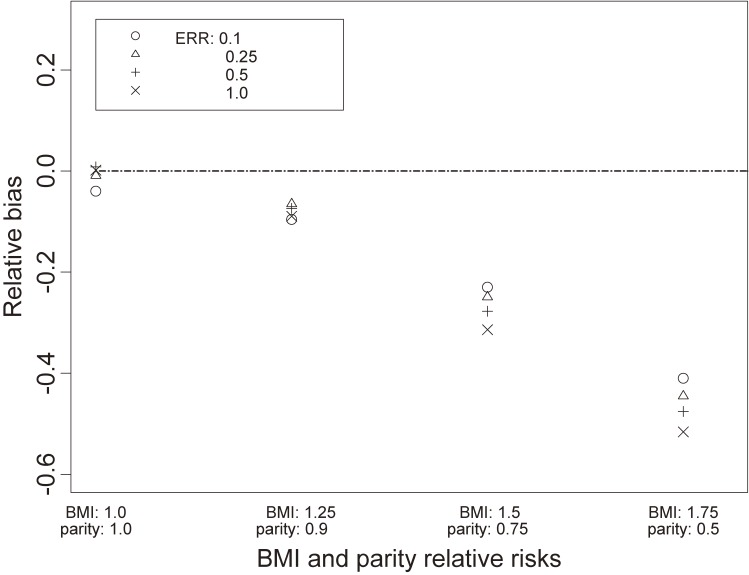
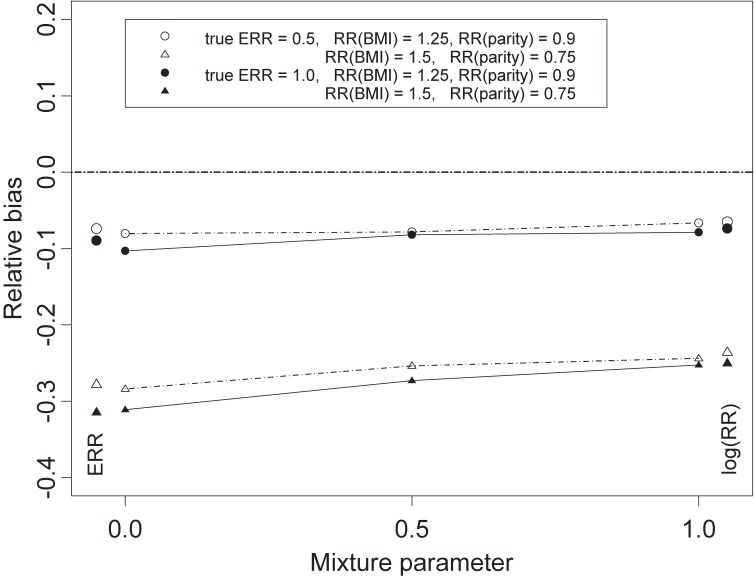
Methods: We employed simulation to study the effects on risk estimation of omitting non-confounding predictive covariates from an excess relative risk (ERR) model and a general additive-multiplicative relative-risk mixture model for binary outcome data in a case-control setting. We also compared the results to the effects with ordinary logistic regression.
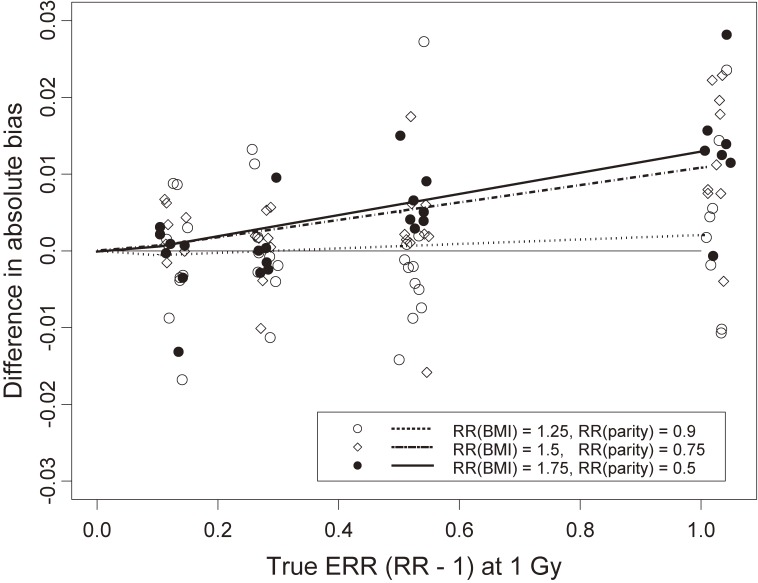
Results: For these commonly employed alternative relative-risk models, the bias was similar to that with logistic regression when the risk was small. More generally, the bias and standard error of the risk-parameter estimates demonstrated patterns that are similar to those with logistic regression, but with greater magnitude depending on the true value of the risk. The magnitude of bias and standard error had little relation to study size or underlying disease prevalence.
Conclusions: Prior conclusions regarding omitted covariates in logistic regression models can be qualitatively applied to the ERR and the general additive-multiplicative relative-risk mixture model without substantial change. Quantitatively, however, these alternative models may have slightly greater omitted-covariate bias, depending on the magnitude of the true risk being estimated.
Keywords: bias; binary outcomes; general relative-risk model; generalized nonlinear model; logistic regression; omitted covariate.
Figures
Similar articles
-
An evaluation of bias in propensity score-adjusted non-linear regression models.Stat Methods Med Res. 2018 Mar;27(3):846-862. doi: 10.1177/0962280216643739. Epub 2016 Apr 19. Stat Methods Med Res. 2018. PMID: 27095754
-
On the analysis of composite measures of quality in medical research.Stat Methods Med Res. 2017 Apr;26(2):633-660. doi: 10.1177/0962280214553330. Epub 2014 Oct 8. Stat Methods Med Res. 2017. PMID: 25296866
-
The alarming problems of confounding equivalence using logistic regression models in the perspective of causal diagrams.BMC Med Res Methodol. 2017 Dec 28;17(1):177. doi: 10.1186/s12874-017-0449-7. BMC Med Res Methodol. 2017. PMID: 29281984 Free PMC article.
-
Bias in Odds Ratios From Logistic Regression Methods With Sparse Data Sets.J Epidemiol. 2023 Jun 5;33(6):265-275. doi: 10.2188/jea.JE20210089. Epub 2022 Apr 1. J Epidemiol. 2023. PMID: 34565762 Free PMC article. Review.
-
Determining Associations and Estimating Effects with Regression Models in Clinical Anesthesia.Anesthesiology. 2020 Sep;133(3):500-509. doi: 10.1097/ALN.0000000000003425. Anesthesiology. 2020. PMID: 32788557 Review.
Cited by
-
Impact of confounding by smoking on cancer risk estimates in cohort studies of radiation workers: a simulation study.J Radiat Res. 2025 Mar 24;66(2):115-128. doi: 10.1093/jrr/rraf012. J Radiat Res. 2025. PMID: 40110993 Free PMC article.
-
Maternal persistent marijuana use and cigarette smoking are independently associated with shorter gestational age.Paediatr Perinat Epidemiol. 2020 Nov;34(6):696-705. doi: 10.1111/ppe.12686. Epub 2020 Jun 30. Paediatr Perinat Epidemiol. 2020. PMID: 32602574 Free PMC article.
-
General regression methods for respondent-driven sampling data.Stat Methods Med Res. 2021 Sep;30(9):2105-2118. doi: 10.1177/09622802211032713. Epub 2021 Jul 28. Stat Methods Med Res. 2021. PMID: 34319832 Free PMC article.
References
-
- Robinson LD, Jewell NP. Some surprising results about covariate adjustment in logistic regression models. Int Stat Rev. 1991;58:227–240. 10.2307/1403444 - DOI
-
- Gail MH, Wieand S, Piantadosi S. Biased estimates of treatment effect in randomized experiments with nonlinear regressions and omitted covariates. Biometrika. 1984;71:431–444. 10.1093/biomet/71.3.431 - DOI
-
- Neuhaus JM, Jewell NP. A geometric approach to assess bias due to omitted covariates in generalized linear models. Biometrika. 1993;80:807–815. 10.1093/biomet/80.4.807 - DOI
-
- Petersen MR, Deddens JA. Effects of omitting a covariate in Poisson models when the data are balanced. Can J Stat. 2000;28:439–445. 10.2307/3315990 - DOI
MeSH terms
LinkOut - more resources
Full Text Sources
Other Literature Sources