

Dietary Supplementation with Nondigestible Oligosaccharides Reduces Allergic Symptoms and Supports Low Dose Oral Immunotherapy in a Peanut Allergy Mouse Model
- PMID: 30102006
- PMCID: PMC6766954
- DOI: 10.1002/mnfr.201800369
Dietary Supplementation with Nondigestible Oligosaccharides Reduces Allergic Symptoms and Supports Low Dose Oral Immunotherapy in a Peanut Allergy Mouse Model
Abstract
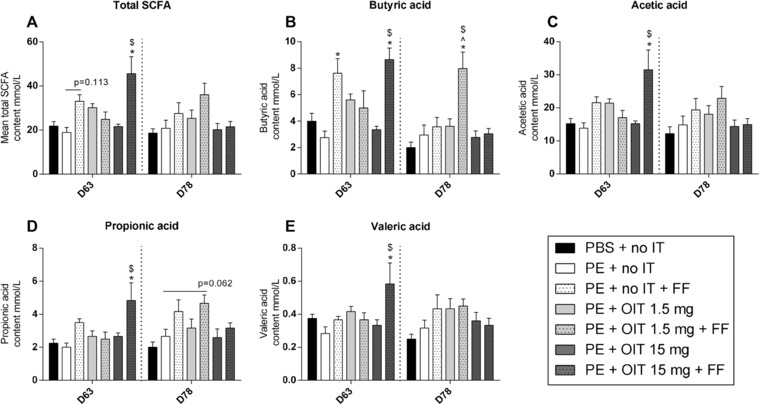
Scope: A major downside of oral immunotherapy (OIT) for food allergy is the risk of severe side effects. Non-digestible short- and long-chain fructo-oligosaccharides (scFOS/lcFOS) reduce allergy development in murine models. Therefore, it is hypothesized that scFOS/lcFOS can also support the efficacy of OIT in a peanut allergy model.
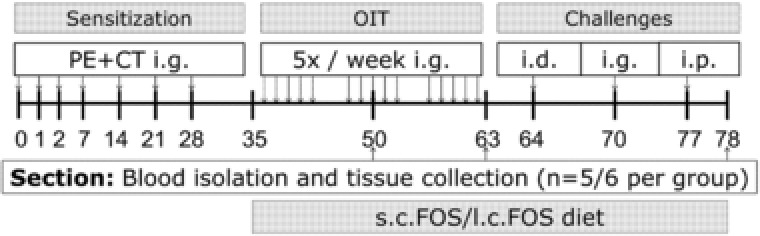
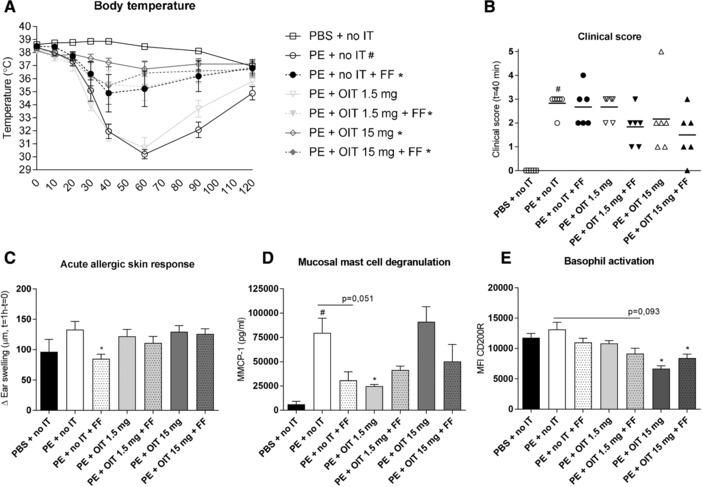
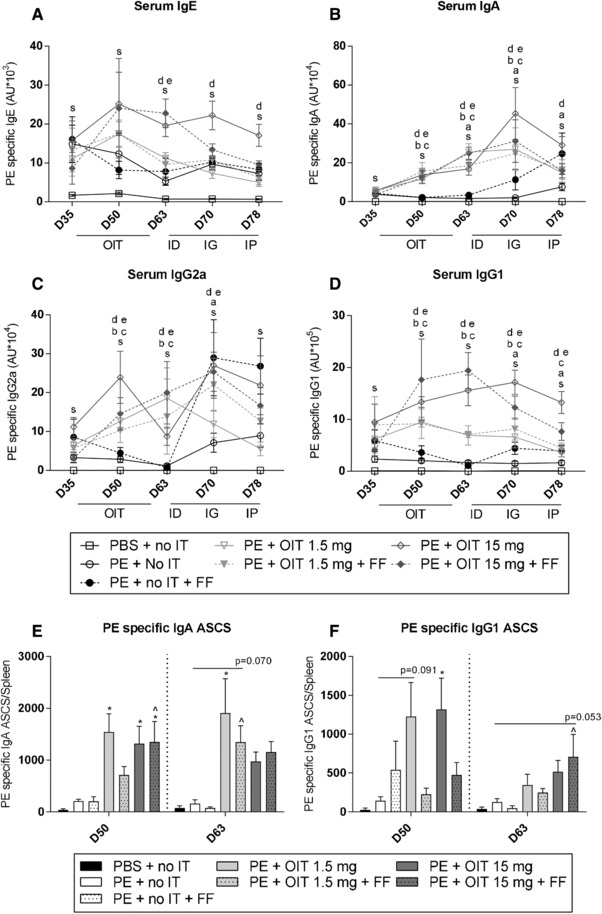
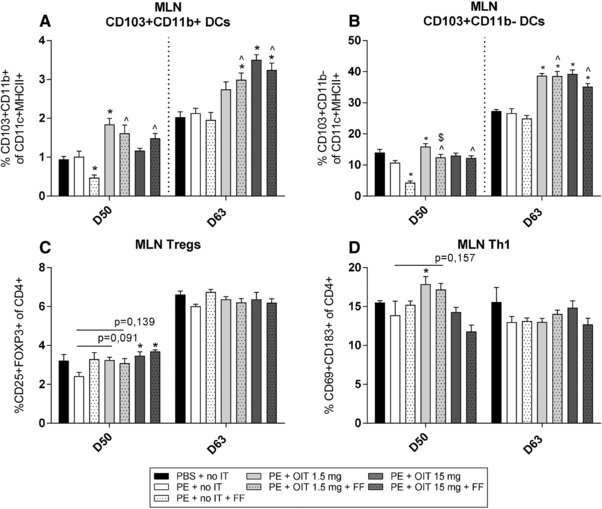
Methods and results: After sensitization to peanut extract (PE) using cholera toxin, C3H/HeOuJ mice are fed a 1% scFOS/lcFOS or control diet and receive OIT (1.5 or 15 mg PE). Hereafter, mice are exposed to PE via different routes to determine the safety and efficacy of treatment in clinical outcomes, PE-specific antibody production, and numbers of various immune cells. scFOS/lcFOS increases short-chain fatty acid levels in the caecum and reduce the acute allergic skin response and drop in body temperature after PE exposure. Interestingly, 15 mg and 1.5 mg OIT with scFOS/lcFOS induce protection against anaphylaxis, whereas 1.5 mg OIT alone does not. OIT, with or without scFOS/lcFOS, induces PE-specific immunoglobulin (Ig) IgG and IgA levels and increases CD103+ dendritic cells in the mesenteric lymph nodes.
Conclusions: scFOS/lcFOS and scFOS/lcFOS combined with low dose OIT are able to protect against a peanut-allergic anaphylactic response.
Keywords: mouse model; non-digestible oligosaccharides; oral immunotherapy; peanut allergy.
© 2018 WILEY-VCH Verlag GmbH & Co. KGaA, Weinheim.
Conflict of interest statement
None of the authors have a competing financial interest in relation to the presented work; L.K. is employed by Nutricia Research, and B.E. and J.G. are partly employed by Nutricia Research B.V. Utrecht, The Netherlands.
Figures
Similar articles
-
Non-digestible oligosaccharides scFOS/lcFOS facilitate safe subcutaneous immunotherapy for peanut allergy.Clin Mol Allergy. 2019 Apr 4;17:7. doi: 10.1186/s12948-019-0111-5. eCollection 2019. Clin Mol Allergy. 2019. PMID: 30988664 Free PMC article.
-
Exposure of Intestinal Epithelial Cells to Short- and Long-Chain Fructo-Oligosaccharides and CpG Oligodeoxynucleotides Enhances Peanut-Specific T Helper 1 Polarization.Front Immunol. 2018 May 11;9:923. doi: 10.3389/fimmu.2018.00923. eCollection 2018. Front Immunol. 2018. PMID: 29867934 Free PMC article.
-
Non-Digestible Oligosaccharides Can Suppress Basophil Degranulation in Whole Blood of Peanut-Allergic Patients.Front Immunol. 2018 Jun 11;9:1265. doi: 10.3389/fimmu.2018.01265. eCollection 2018. Front Immunol. 2018. PMID: 29942305 Free PMC article.
-
[The clinical advances of the peanut oral immunotherapy].Zhonghua Yu Fang Yi Xue Za Zhi. 2021 May 6;55(5):592-597. doi: 10.3760/cma.j.cn112150-20210308-00226. Zhonghua Yu Fang Yi Xue Za Zhi. 2021. PMID: 34034398 Review. Chinese.
-
Current Status of Potential Therapies for IgE-Mediated Food Allergy.Curr Allergy Asthma Rep. 2018 Feb 22;18(3):18. doi: 10.1007/s11882-018-0772-z. Curr Allergy Asthma Rep. 2018. PMID: 29470658 Review.
Cited by
-
Preclinical evaluation of alternatives to oral immunotherapy for food allergies.Front Allergy. 2023 Oct 3;4:1275373. doi: 10.3389/falgy.2023.1275373. eCollection 2023. Front Allergy. 2023. PMID: 37859977 Free PMC article. Review.
-
A network-based approach for identifying suitable biomarkers for oral immunotherapy of food allergy.BMC Bioinformatics. 2019 Apr 23;20(1):206. doi: 10.1186/s12859-019-2802-9. BMC Bioinformatics. 2019. PMID: 31014233 Free PMC article.
-
Allergen-specific IgA and IgG antibodies as inhibitors of mast cell function in food allergy.Front Allergy. 2024 Jun 11;5:1389669. doi: 10.3389/falgy.2024.1389669. eCollection 2024. Front Allergy. 2024. PMID: 38919913 Free PMC article. Review.
-
Low-dose oral immunotherapy in immunoglobulin E-mediated food allergies.Front Immunol. 2024 Feb 1;15:1321863. doi: 10.3389/fimmu.2024.1321863. eCollection 2024. Front Immunol. 2024. PMID: 38361918 Free PMC article. Review.
-
Allergenic protein-induced type I hypersensitivity models: a review.Front Allergy. 2024 Oct 17;5:1481011. doi: 10.3389/falgy.2024.1481011. eCollection 2024. Front Allergy. 2024. PMID: 39483683 Free PMC article. Review.
References
Publication types
MeSH terms
Substances
LinkOut - more resources
Full Text Sources
Other Literature Sources
Medical
Research Materials
Miscellaneous
