Review
. 2019 Jan 28;58(5):1266-1279.
doi: 10.1002/anie.201806482. Epub 2018 Nov 5.

RNA Structure and Cellular Applications of Fluorescent Light-Up Aptamers

Affiliations
Review

RNA Structure and Cellular Applications of Fluorescent Light-Up Aptamers

Saskia Neubacher et al. Angew Chem Int Ed Engl. .

Abstract

The cellular functions of RNA are not limited to their role as blueprints for protein synthesis. In particular, noncoding RNA, such as, snRNAs, lncRNAs, miRNAs, play important roles. With increasing numbers of RNAs being identified, it is well known that the transcriptome outnumbers the proteome by far. This emphasizes the great importance of functional RNA characterization and the need to further develop tools for these investigations, many of which are still in their infancy. Fluorescent light-up aptamers (FLAPs) are RNA sequences that can bind nontoxic, cell-permeable small-molecule fluorogens and enhance their fluorescence over many orders of magnitude upon binding. FLAPs can be encoded on the DNA level using standard molecular biology tools and are subsequently transcribed into RNA by the cellular machinery, so that they can be used as fluorescent RNA tags (FLAP-tags). In this Minireview, we give a brief overview of the fluorogens that have been developed and their binding RNA aptamers, with a special focus on published crystal structures. A summary of current and future cellular FLAP applications with an emphasis on the study of RNA-RNA and RNA-protein interactions using split-FLAP and Förster resonance energy transfer (FRET) systems is given.

Keywords: RNA imaging; RNA structures; RNA-protein interactions; fluorescent light-up aptamers (FLAPs); fluorogenic probes.


Conflict of interest statement

The authors declare no conflict of interest.

Figures
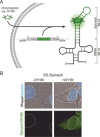
Figure 1
Figure 1
Schematic overview of FLAP. A) A DNA construct carrying the genetic information for an RNA scaffolding structure (tRNA) and the aptamer (Spinach in green) is transferred into a cell and transcribed into RNA by the cellular transcriptional machinery. A small molecule fluorogen, which is highly cell permeable and non‐toxic, is applied and binds to the aptamer RNA. This leads to a drastic increase in fluorescence. We refer to these systems as fluorescence light‐up aptamers (FLAPs). B) Spinach, the first non‐toxic FLAP, was fused to the 5S rRNA and expressed in HEK293T cells. Images were taken without and after the addition of DFHBI fluorogen and monitored. An overlay of phase contrast and nuclear staining using Hoechst shows the location of the cell and its nucleus (dashed white line). Image modified from Paige et al.36
Figure 2
Figure 2
Fluorogens for FLAPs. A) GFP‐derived fluorogens: 3,5‐dimethoxy‐4‐hydroxybenzylidene imidazolinone (DMHBI), 3,5‐difluoro‐4‐hydroxybenzylidene imidazolinone (DFHBI), (Z)‐4‐(3,5‐difluoro‐4‐hydroxybenzylidene)‐2‐methyl‐1‐(2,2,2‐trifluoroethyl)‐1H‐imidazol‐5(4H)‐one) (DFHBI‐1T), and 3,5‐difluoro‐4‐hydroxybenzyli‐dene‐imidazolinone‐2‐oxime (DFHO). B) Asymmetrical cyanine dyes: biotin‐modified thiazol orange derivatives (TO1‐biotin and TO3‐biotin), an oxazole yellow derivative (YO3‐biotin), a dimethylindole red analogue (DIR‐Pro), and an oxazole thiazole blue analogue (OTB‐SO3). C) Fluorophore‐quencher conjugates: sulforhodamine–dinitroaniline (SR‐DN).
Figure 3
Figure 3
Overview of available FLAPs. The spectral range of emission wavelengths (arrows) of various FLAPs and their fluorogens.
Figure 4
Figure 4
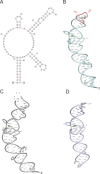
Comparison of spinach structures. A) Secondary‐structure prediction by mfold using default settings for RNA.100 The previously reported36 secondary structure for spinach could be reproduced as top third solution (ΔG=−35.50 kcal mol−1). B–D) Spinach X‐ray crystal structure variants. B) Fab BL3‐6 assisted approach, PDB ID: 4kzd.62 C) Split hybridization approach, PDB ID: 4ts0.68 D) iSpinach, PDB ID: 5ob3.64 Dotted line indicates loop used for separation of the two strands during construct design. Red region shows 7‐nt Fab BL3‐6 recognition motif. Green=bound DFHBI fluorogen.
Figure 5
Figure 5
Spinach–DFHBI crystal structure (PDB ID: 4ts2).62 A) Crystal structure of Spinach; names of structural features are indicated. Black=substituted nucleotides for stabilization through Watson–Crick base pairs; Green=DFHBI, pink and purple spheres=Mg2+ and K+ ions; blue colored region=DFHBI‐binding region including G‐quadruplex; dotted line=cleavage site for crystal construct design (L3 loop region). B) Sequence of the crystallized Spinach sequence by Warner et al.62 Lower case=substituted nucleotides for stabilization through Watson–Crick base pairs; bold=G‐quadruplex forming nucleotides; underlined=triplex‐lid‐forming nucleotides. C) Close‐up view of the fluorogen‐binding region. G‐quadruplex tiers are shown, and shaped platforms are indicated by blue planes. Each plane coordinates a K+ ion (purple). DFHBI is shown in addition to its coordinating G31. The closing triplex lid is highlighted on top of DFHBI. D) Schematic overview of Spinach–DFHBI fluorogen‐binding region. Numbers indicate the nucleotide numbers from Spinach according to (B).
Figure 6
Figure 6
Structural overview of Mango–TO1‐biotin (PDB ID: 5bjo).70 A) Sequence of Mango core sequence (23 nt) plus a 4‐nt fusion on 5′‐ and 3‐ end forming a 4‐bp RNA duplex stem. Guanosines of the three G‐quadruplex tiers are indicated. Underlined nt form the lid structure. B) Crystal structure of one Mango monomer of the ASU. Light grey=4‐bp‐stabilizing RNA duplex; Blue=G‐quadruplex tiers (1–3), violet spheres=potassium ions; dark blue=TO1‐biotin fluorogen; bases of the lid structure are labeled. C) Schematic overview of the Mango TO1‐biotin‐binding region. Numbers indicate the nucleotide numbers from Mango according to (A). D,E) Two perspectives of TO1‐biotin binding to the lid structure composed of U15 stabilizing the biotin moiety through hydrogen bonds (black dashed lines) and A20 and A26 forming π–π interactions with the methylchinoline (MQ with A20) and the benzothiazole (BzT with A26) moiety of TO1‐biotin.
Figure 7
Figure 7
Corn–DFHO crystal structure (PDB ID: 5bjo).71 A) Crystal structure of Corn; names of structural features are indicated. Orange=aptamer A; light orange=aptamer B of the homodimer complex; purple spheres=Mg2+ and K+ ions; blue colored region=DFHO‐binding region including G‐quadruplex. B) Sequence of the crystallized Corn sequence by Warner et al.71 Bold=G‐quadruplex‐forming nucleotides. C) Close‐up of the fluorogen‐binding region. G‐quadruplex tiers are shown, and shaped platforms are indicated by orange planes. Each plane coordinates a potassium ion (purple). DFHO is shown in addition to its flanking nucleotides A24 of aptamer one and A14* of the second aptamer copy. D) Schematic overview of Corn–DFHO binding region. Numbers indicate the nucleotide numbers according to (B).
Figure 8
Figure 8
Fluorogen coordination in Spinach–DFHBI (A) and Corn–DFHO (B). Dashed lines indicate hydrogen‐bond formation to flanking nucleotides.
Figure 9
Figure 9
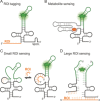
FLAP fusions to other RNAs for application in live cells. A) FLAP‐tagged RNA of interest (ROI). B) Bifunctional FLAPs through fusion to a metabolite‐sensing aptamer or riboswitch. C) Small RNA‐sensing FLAP. D) mRNA‐sensing split‐FLAP.
Figure 10
Figure 10
Complementation systems for the detection of RNA–RNA interactions. A) Schematic representation of the Corn homodimer with its according fluorogen (yellow=DFHO). The two ROIs need to be fused to a unique Corn derivative (black and grey) to avoid spontaneous self‐assembly. Interaction of the two ROIs will then trigger Corn fluorescence. B) Schematic representation of split‐dBroccoli with its according fluorogen (green=DFHBI‐1T). The two ROIs need to be fused to one of the two dBroccoli strands. Integration of base pair mismatches between both dBroccoli strands will avoid spontaneous self‐assembly. Interaction of the two ROIs will then trigger dBroccoli fluorescence. C) Scheme of a Spinach–Mango fusion construct with the corresponding fluorogens [Spinach (green): DFHBI‐1T, Mango (red): YO3‐biotin] used in a FRET setup (apta‐FRET). Rational fusion construct design brings both FLAPs into close proximity and induces FRET fluorescence. Microscopy images (black box) of bacteria expressing this apta‐FRET construct show each individual FLAP fluorescence (green and red image) and a FRET signal of the acceptor fluorescence (greyscale image). For a bimolecular interaction technique, the two ROIs need to be fused to one of these FLAPs. Proximity induced by ROI interaction triggers FRET fluorescence. Scale bar: 10 μm, orange and blue indicate the two interacting ROIs, image modified from Jepsen et al.97
Figure 11
Figure 11
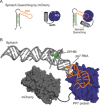
Spinach donor‐quenching for a FRET based RNA–protein interaction assay. A) An ROI (orange) is fused to Spinach as a fluorescence donor (black). A POI (dark blue) is fused to the mCherry protein (dark grey) as a quencher. Upon interaction of RNA and protein of interest, Spinach donor‐quenching occurs due to close proximity of the two fluorophores. B) Structural model of biomolecules used in (A). The model was constructed from X‐ray crystal structures of the PP7‐protein (dark blue surface) bound to its pp7‐RNA (orange stick model, PDB ID: 2qux),101 Spinach–DFHBI (light grey stick model, DFHBI shown as a green space‐filling, PDB ID: 4ts2),62 and mCherry (dark grey surface, PDB ID: 2h5q).102

Similar articles

Cited by

References

    1. König J., Zarnack K., Luscombe N. M., Ule J., Nat. Rev. Genet. 2012, 13, 77–83. - PubMed
    1. Mercer T. R., Dinger M. E., Mattick J. S., Nat. Rev. Genet. 2009, 10, 155–159. - PubMed
    1. Holt C. E., Schuman E. M., Neuron 2013, 80, 648–657. - PMC - PubMed
    1. McHugh C. A., Russell P., Guttman M., Chen M., Manley J., Licatalosi D., Darnell R., Wang Z., Gerstein M., Snyder M., et al., Genome Biol. 2014, 15, 1–10. - PubMed
    1. Ghildiyal M., Zamore P. D., Nat. Rev. Genet. 2009, 10, 94–108. - PMC - PubMed