Meta-Analysis
. 2018 Nov;144(11):1186-1199.
doi: 10.1037/bul0000163. Epub 2018 Aug 13.

Binocular summation revisited: Beyond √2

Affiliations
Meta-Analysis

Binocular summation revisited: Beyond √2

Daniel H Baker et al. Psychol Bull. 2018 Nov.

Abstract

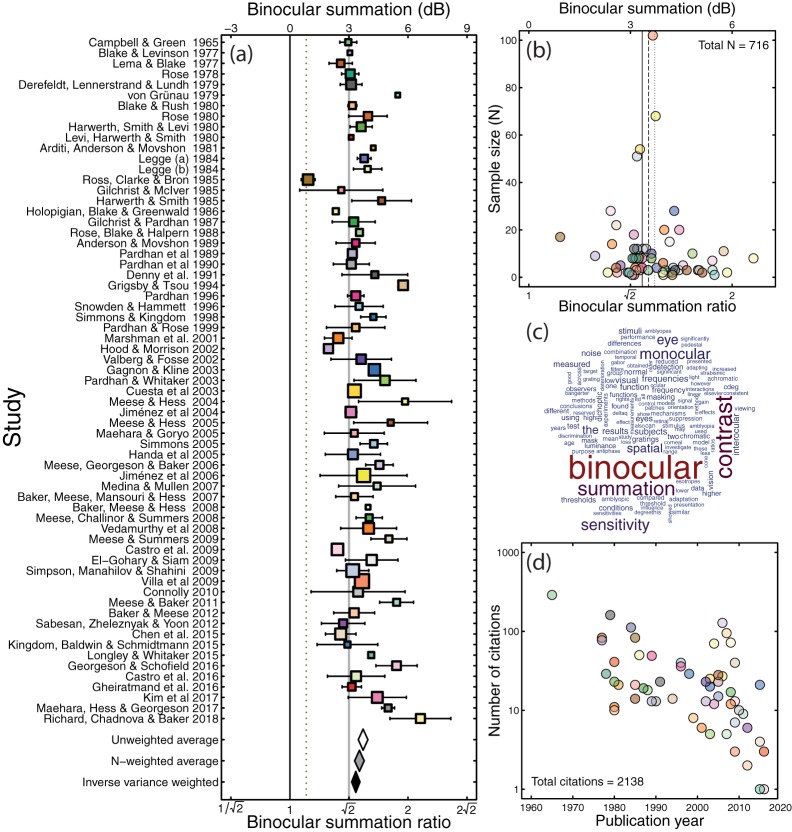
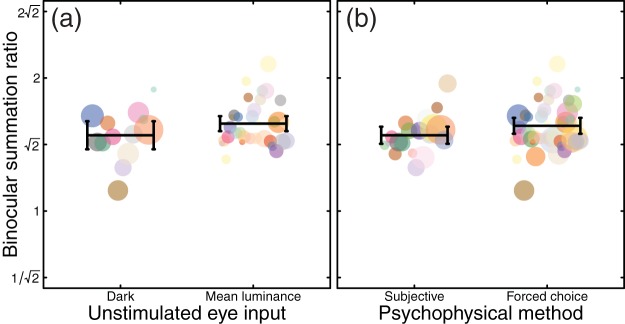
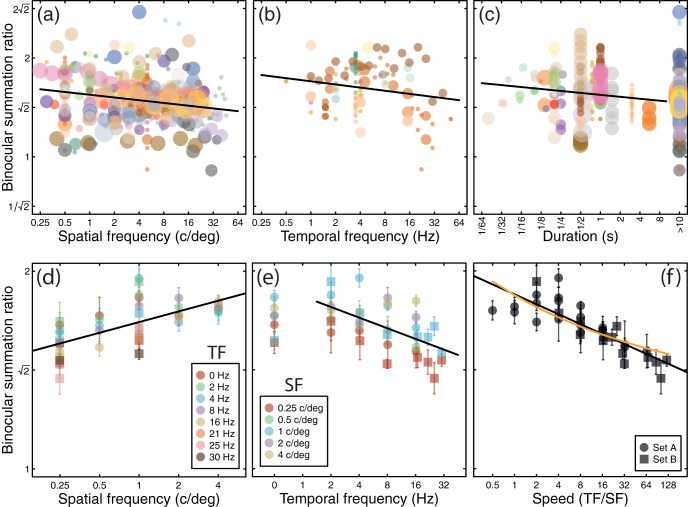
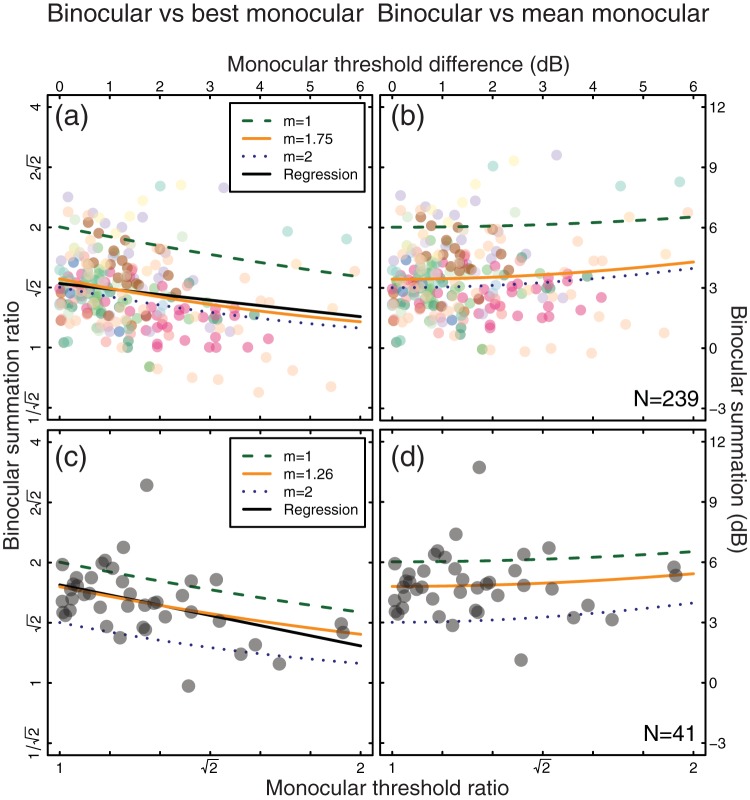
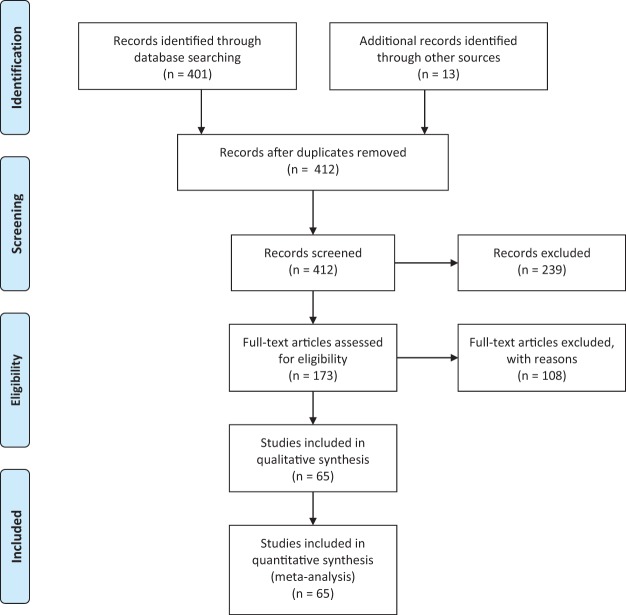
Our ability to detect faint images is better with two eyes than with one, but how great is this improvement? A meta-analysis of 65 studies published across more than 5 decades shows definitively that psychophysical binocular summation (the ratio of binocular to monocular contrast sensitivity) is significantly greater than the canonical value of √2. Several methodological factors were also found to affect summation estimates. Binocular summation was significantly affected by both the spatial and temporal frequency of the stimulus, and stimulus speed (the ratio of temporal to spatial frequency) systematically predicts summation levels, with slow speeds (high spatial and low temporal frequencies) producing the strongest summation. We furthermore show that empirical summation estimates are affected by the ratio of monocular sensitivities, which varies across individuals, and is abnormal in visual disorders such as amblyopia. A simple modeling framework is presented to interpret the results of summation experiments. In combination with the empirical results, this model suggests that there is no single value for binocular summation, but instead that summation ratios depend on methodological factors that influence the strength of a nonlinearity occurring early in the visual pathway, before binocular combination of signals. Best practice methodological guidelines are proposed for obtaining accurate estimates of neural summation in future studies, including those involving patient groups with impaired binocular vision. (PsycINFO Database Record (c) 2018 APA, all rights reserved).


Figures

Figure 1
Figure 1
Meta-analysis summary. (a) Forest plot of binocular summation across 65 studies. Square symbol width is proportional to the log of the sample size plus one. Error bars give 95% confidence intervals, estimated using the approximation ±1.96 × SE. The black vertical line gives the line of no effect, where binocular and monocular sensitivities are equal. The dashed vertical line gives an estimate of probability summation for two independently noisy signals. The gray vertical line gives the traditional value of √2. The white diamond gives the average across all studies (3.72 dB, or a ratio of 1.53), weighting each study equally (ignoring sample size). The gray diamond gives the average weighted by the sample size of each study (3.54 dB, or a ratio of 1.50). The black diamond gives the average weighted by the inverse variance of each study (3.35 dB, or a ratio of 1.47). This latter estimate comprises only 55 studies, as a measure of variance was unavailable for 10 studies. The width of the diamonds spans the 95% confidence intervals. (b) Funnel plot showing sample size plotted against binocular summation for all 65 studies. The distribution of summation ratios is approximately symmetrical about the means (with the dotted, dashed, and solid lines corresponding to the white, gray, and black diamonds from Panel a). (c) Word cloud showing the most frequent words used in the abstracts of studies included in the meta-analysis. (d) Number of citations per article included (obtained from Web of Knowledge on January 29, 2018), plotted against year of publication. Articles with no citations are omitted. Colors in Panels b and d correspond to those in Panel a.
Figure 2
Figure 2
Effect of methodology on binocular summation. (a) Compares studies in which the unstimulated eye (in monocular conditions) viewed mean luminance, with studies in which it wore a patch and was therefore dark. (b) Compares studies that used criterion free forced-choice methods with studies that used other methods (such as the method of adjustment, or yes/no tasks). In both panels, data from a single study have a color consistent with Figure 1a, and symbol diameter is proportional to the base-10 logarithm of sample size (plus an added constant to avoid sizes of zero for studies with only one participant). Black horizontal lines in give the unweighted means across studies, and error bars give 95% confidence intervals.
Figure 3
Figure 3
Effects of spatial and temporal stimulus properties on binocular summation. The upper row shows data from the meta-analysis, plotting summation as a function of spatial frequency (a), temporal frequency (b), and stimulus duration (c) using the same symbol size and color conventions as in Figure 2. In (c), studies that allowed unlimited inspection time are assigned a duration of >10 s. The lower row shows the results of two experiments measuring binocular summation as a function of spatial frequency (d), temporal frequency (e), and speed (f), given by the ratio of temporal frequency to spatial frequency, in deg/s. The same data are reproduced in each panel, except that the 0 Hz data are omitted from Panel f. Error bars indicate ±1 SE of the mean across observers (N = 4 for each data point). Black lines in all panels are best fitting regression lines (on log-transformed values), and the orange curve in (f) is the prediction of Equation 2 when the exponent m depends on stimulus speed (see text for details).
Figure 4
Figure 4
Change in binocular summation as a function of monocular sensitivity imbalance. (a, c) Summation is calculated as the ratio of the binocular threshold and better of the two monocular thresholds. (b, d) Summation is calculated as the ratio of the binocular threshold and the average of the two monocular thresholds. In all panels, a monocular threshold ratio of 1 indicates equal monocular sensitivities, and a ratio of 2 means that one eye was twice as sensitive as the other. Each data point represents one observer, either from studies in the meta-analysis with diverse spatiotemporal conditions (Panels a and b; N = 239), or from a stand-alone experiment with constant stimulus properties (Panels c and d; N = 41). The black curves in Panels a and c are the best fitting regression line (using logarithmic values), with slopes of −0.3 (a) and −0.5 (c) and y intercepts of 3.20 dB (a) and 4.89 dB (c). The remaining curves show summation predictions for a linear transducer (green dashed curves), square law transducer (blue dotted curves), and best fitting exponents (orange solid curves) under both calculation schemes.
Figure A1
Figure A1
PRISMA flow diagram.

References

    1. *Anderson P. A., & Movshon J. A. (1989). Binocular combination of contrast signals. Vision Research, 29, 1115–1132. 10.1016/0042-6989(89)90060-6 - DOI - PubMed
    1. *Arditi A. R., Anderson P. A., & Movshon J. A. (1981). Monocular and binocular detection of moving sinusoidal gratings. Vision Research, 21, 329–336. 10.1016/0042-6989(81)90160-7 - DOI - PubMed
    1. Baker D. H., & Graf E. W. (2009). On the relation between dichoptic masking and binocular rivalry. Vision Research, 49, 451–459. 10.1016/j.visres.2008.12.002 - DOI - PubMed
    1. *Baker D. H., & Meese T. S. (2012). Interocular transfer of spatial adaptation is weak at low spatial frequencies. Vision Research, 63, 81–87. 10.1016/j.visres.2012.05.002 - DOI - PubMed
    1. *Baker D. H., Meese T. S., & Hess R. F. (2008). Contrast masking in strabismic amblyopia: Attenuation, noise, interocular suppression and binocular summation. Vision Research, 48, 1625–1640. 10.1016/j.visres.2008.04.017 - DOI - PubMed

Publication types