

High Single Doses of Radiation May Induce Elevated Levels of Hypoxia in Early-Stage Non-Small Cell Lung Cancer Tumors
- PMID: 30102194
- PMCID: PMC6092043
- DOI: 10.1016/j.ijrobp.2018.05.032
High Single Doses of Radiation May Induce Elevated Levels of Hypoxia in Early-Stage Non-Small Cell Lung Cancer Tumors
Abstract
Purpose: Tumor hypoxia correlates with treatment failure in patients undergoing conventional radiation therapy. However, no published studies have investigated tumor hypoxia in patients undergoing stereotactic body radiation therapy (SBRT). We aimed to noninvasively quantify the tumor hypoxic volume (HV) in non-small cell lung cancer (NSCLC) tumors to elucidate the potential role of tumor vascular response and reoxygenation at high single doses.
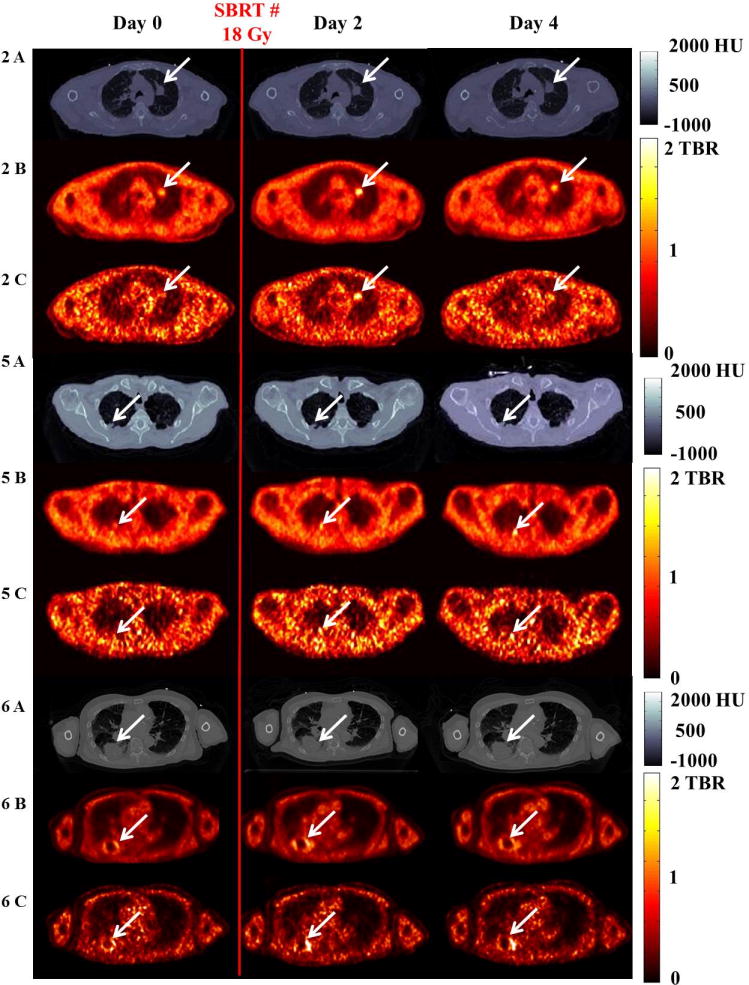
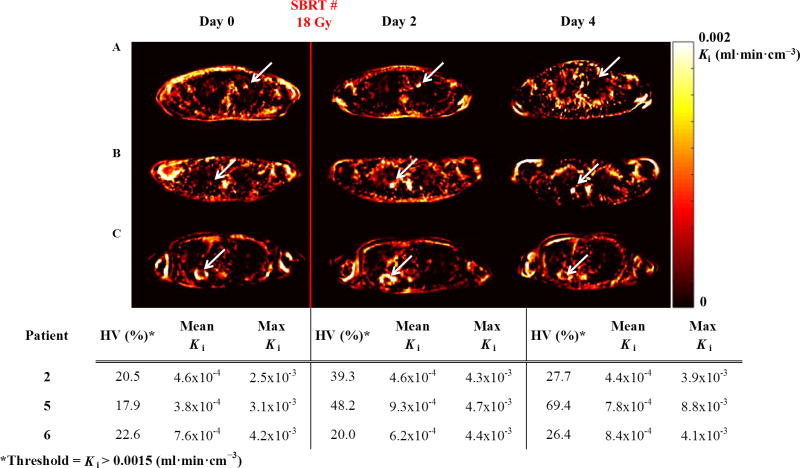
Methods and materials: Six SBRT-eligible patients with NSCLC tumors >1 cm were prospectively enrolled in an institutional review board-approved study. Dynamic positron emission tomography images were acquired at 0 to 120 minutes, 150 to 180 minutes, and 210 to 240 minutes after injection of 18F-fluoromisonidazole. Serial imaging was performed prior to delivery of 18 Gy and at approximately 48 hours and approximately 96 hours after SBRT. Tumor HVs were quantified using the tumor-to-blood ratio (>1.2) and rate of tracer influx (>0.0015 mL·min·cm-3).
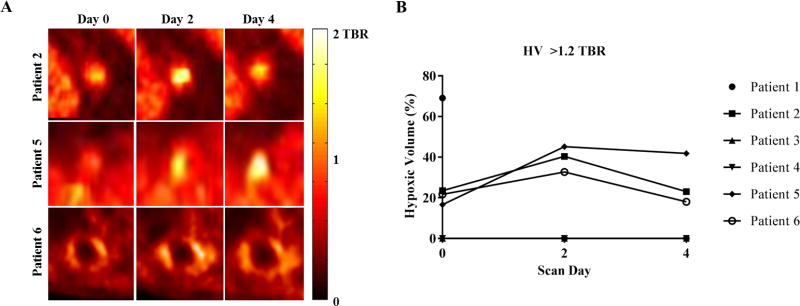
Results: An elevated and in some cases persistent level of tumor hypoxia was observed in 3 of 6 patients. Two patients exhibited no detectable baseline tumor hypoxia, and 1 patient with high baseline hypoxia only completed 1 imaging session. On the basis of the tumor-to-blood ratio, in the remaining 3 patients, tumor HVs increased on day 2 after 18 Gy and then showed variable responses on day 4. In the 3 of 6 patients with detectable hypoxia at baseline, baseline tumor HVs ranged between 17% and 24% (mean, 21%), and HVs on days 2 and 4 ranged between 33% and 45% (mean, 40%) and between 18% and 42% (mean, 28%), respectively.
Conclusions: High single doses of radiation delivered as part of SBRT may induce an elevated and in some cases persistent state of tumor hypoxia in NSCLC tumors. Hypoxia imaging with 18F-fluoromisonidazole positron emission tomography should be used in a larger cohort of NSCLC patients to determine whether elevated tumor hypoxia is predictive of treatment failure in SBRT.
Copyright © 2018 Elsevier Inc. All rights reserved.
Conflict of interest statement
Olivia J. Kelada: None
Roy H. Decker: None
Sameer K. Nath: None
Kimberly L. Johung: None
Ming-Qiang Zheng: None
Yiyun Huang: None
Jean-Dominique Gallezot: None
Chi Liu: None
Richard E. Carson: None
Uwe Oelfke: None
David J. Carlson: None
Figures

Similar articles
-
Impact of SBRT fractionation in hypoxia dose painting - Accounting for heterogeneous and dynamic tumor oxygenation.Med Phys. 2019 May;46(5):2512-2521. doi: 10.1002/mp.13514. Epub 2019 Apr 14. Med Phys. 2019. PMID: 30924937
-
CyberKnife radiosurgery for inoperable stage IA non-small cell lung cancer: 18F-fluorodeoxyglucose positron emission tomography/computed tomography serial tumor response assessment.J Hematol Oncol. 2010 Feb 4;3:6. doi: 10.1186/1756-8722-3-6. J Hematol Oncol. 2010. PMID: 20132557 Free PMC article. Clinical Trial.
-
A pilot trial of serial 18F-fluorodeoxyglucose positron emission tomography in patients with medically inoperable stage I non-small-cell lung cancer treated with hypofractionated stereotactic body radiotherapy.Int J Radiat Oncol Biol Phys. 2010 Mar 1;76(3):789-95. doi: 10.1016/j.ijrobp.2009.02.051. Epub 2009 May 25. Int J Radiat Oncol Biol Phys. 2010. PMID: 19473777 Free PMC article. Clinical Trial.
-
Local Control After Stereotactic Body Radiation Therapy for Stage I Non-Small Cell Lung Cancer.Int J Radiat Oncol Biol Phys. 2021 May 1;110(1):160-171. doi: 10.1016/j.ijrobp.2019.03.045. Epub 2019 Apr 5. Int J Radiat Oncol Biol Phys. 2021. PMID: 30954520 Free PMC article. Review.
-
Stereotactic Body Radiation Therapy for Early-Stage Non-Small Cell Lung Cancer: A Primer for Radiologists.Radiographics. 2018 Sep-Oct;38(5):1312-1336. doi: 10.1148/rg.2018170155. Epub 2018 Aug 3. Radiographics. 2018. PMID: 30074857 Review.
Cited by
-
Advances in Radiobiology of Stereotactic Ablative Radiotherapy.Front Oncol. 2020 Aug 7;10:1165. doi: 10.3389/fonc.2020.01165. eCollection 2020. Front Oncol. 2020. PMID: 32850333 Free PMC article. Review.
-
AKBA inhibits radiotherapy resistance in lung cancer by inhibiting maspin methylation and regulating the AKT/FOXO1/p21 axis.J Radiat Res. 2023 Jan 20;64(1):33-43. doi: 10.1093/jrr/rrac064. J Radiat Res. 2023. PMID: 36300343 Free PMC article.
-
Effectiveness of Robotic Stereotactic Radiotherapy in Patients Undergoing Re-irradiation: A Review.Cureus. 2023 Aug 15;15(8):e43500. doi: 10.7759/cureus.43500. eCollection 2023 Aug. Cureus. 2023. PMID: 37719625 Free PMC article. Review.
-
Radiobiology of stereotactic ablative radiotherapy (SABR): perspectives of clinical oncologists.J Cancer. 2020 Jun 27;11(17):5056-5068. doi: 10.7150/jca.44408. eCollection 2020. J Cancer. 2020. PMID: 32742453 Free PMC article. Review.
-
Live-cell imaging and analysis of 3D spheroids in hypoxia- and radiotherapy-related research.Clin Transl Radiat Oncol. 2025 Jan 15;51:100920. doi: 10.1016/j.ctro.2025.100920. eCollection 2025 Mar. Clin Transl Radiat Oncol. 2025. PMID: 39898333 Free PMC article.
References
-
- Iyengar P, Westover K, Timmerman RD. Stereotactic ablative radiotherapy (sabr) for non-small cell lung cancer. Seminars in respiratory and critical care medicine. 2013;34:845–854. - PubMed
-
- Lo SS, et al. Stereotactic body radiation therapy: A novel treatment modality. Nat Rev Clin Oncol. 2010;7:44–54. - PubMed
-
- Gray LH, et al. The concentration of oxygen dissolved in tissues at the time of irradiation as a factor in radiotherapy. Br J Radiol. 1953;26:638–648. - PubMed
-
- Brown JM, Wilson WR. Exploiting tumour hypoxia in cancer treatment. Nat Rev Cancer. 2004;4:437–447. - PubMed
Publication types
MeSH terms
Grants and funding
LinkOut - more resources
Full Text Sources
Other Literature Sources
Medical
