. 2018 Aug 31;128(9):3991-4007.
doi: 10.1172/JCI98793. Epub 2018 Aug 13.

CD28 blockade controls T cell activation to prevent graft-versus-host disease in primates

Affiliations

CD28 blockade controls T cell activation to prevent graft-versus-host disease in primates

Benjamin K Watkins et al. J Clin Invest. .

Abstract

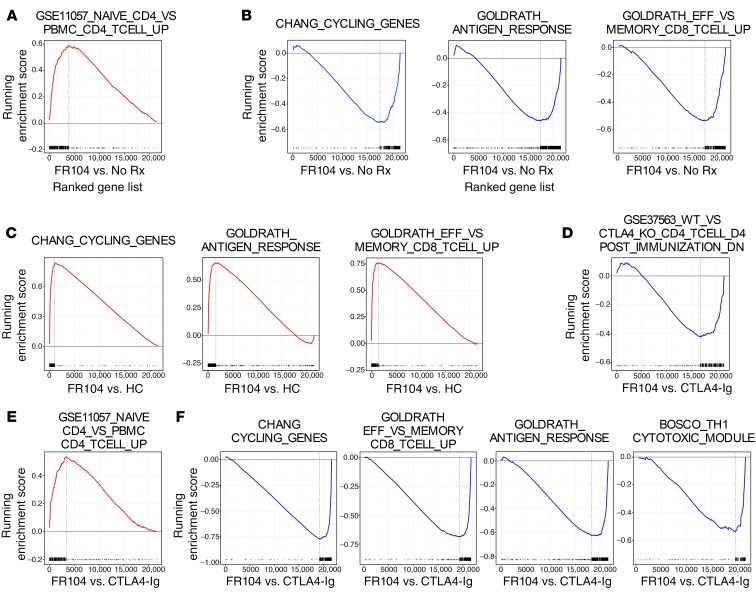
Controlling graft-versus-host disease (GVHD) remains a major unmet need in stem cell transplantation, and new, targeted therapies are being actively developed. CD28-CD80/86 costimulation blockade represents a promising strategy, but targeting CD80/CD86 with CTLA4-Ig may be associated with undesired blockade of coinhibitory pathways. In contrast, targeted blockade of CD28 exclusively inhibits T cell costimulation and may more potently prevent GVHD. Here, we investigated FR104, an antagonistic CD28-specific pegylated-Fab', in the nonhuman primate (NHP) GVHD model and completed a multiparameter interrogation comparing it with CTLA4-Ig, with and without sirolimus, including clinical, histopathologic, flow cytometric, and transcriptomic analyses. We document that FR104 monoprophylaxis and combined prophylaxis with FR104/sirolimus led to enhanced control of effector T cell proliferation and activation compared with the use of CTLA4-Ig or CTLA4-Ig/sirolimus. Importantly, FR104/sirolimus did not lead to a beneficial impact on Treg reconstitution or homeostasis, consistent with control of conventional T cell activation and IL-2 production needed to support Tregs. While FR104/sirolimus had a salutary effect on GVHD-free survival, overall survival was not improved, due to death in the absence of GVHD in several FR104/sirolimus recipients in the setting of sepsis and a paralyzed INF-γ response. These results therefore suggest that effectively deploying CD28 in the clinic will require close scrutiny of both the benefits and risks of extensively abrogating conventional T cell activation after transplant.

Keywords: Bone marrow transplantation; Immunology; Transplantation.


Conflict of interest statement

Conflict of interest: NP, CM, JPS, and BV are shareholders in OSE Immunotherapeutics, a company developing CD28 antagonists.

Figures

Figure 1
Figure 1. The NHP model of aGVHD, FR104 PK, and pharmacodynamics analysis.
(A) Experimental schematic. (B) PK analysis. PK was performed by ELISA on samples collected prior to and 30 minutes after each FR104 dosing and then on days 64, 71, 78, and 85 and at terminal analysis. Data combine FR104 (n = 3) and FR104/sirolimus (n = 9) cohorts. Data are shown as mean ± SEM. The vertical dashed line is drawn at day 66 to indicate the time period after which effective FR104 concentrations were no longer present in the peripheral blood. (C) The relative occupancy of CD28 receptors (number of CD28+ cells detectable with clone CD28.2 antibodies) within CD3+CD14CD20CD4+CD8 (top panel) and CD3+CD14CD20CD4CD8+ (bottom panel) T cell populations measured longitudinally by flow cytometric analysis in FR104 (n = 3) and FR104/sirolimus (n = 9) cohorts. Data are shown as mean ± SEM. Shaded areas represent the time period of FR104 dosing. (D and E) The percentage of CD28+ cells within CD3+CD20CD4+CD8 (top panels) and CD3+CD20CD4CD8+ (bottom panels) T cell populations in blood and tissue from FR104 (n = 3; D) and FR104/sirolimus, euthanized before day 66 after transplant (n = 6) or after day 66 (n = 3). (E) Treated recipients before transplantation and at the time of necropsy measured by flow cytometric analysis.
Figure 2
Figure 2. Clinical aGVHD scoring and aGVHD-free survival.
(A and B) Longitudinal clinical aGVHD scoring (A) and GVHD-free survival curves (B) of untreated (No Rx, n = 11; red), CTLA4-Ig (n = 4; pink), sirolimus (n = 6; orange), FR104 (n = 3; blue), FR104/sirolimus (n = 9; navy), and CTLA4-Ig/sirolimus (n = 7; purple) cohorts. Scoring was based on our previously described NHP aGVHD clinical scoring system (12). GI aGVHD scores from FR104/sirolimus recipients with documented enteric infections were censored. Data are shown as mean ± SEM. For GVHD-free survival analysis, FR104/sirolimus recipients with documented graft rejection were excluded from this analysis. The Kaplan-Meier product-limit method was used to calculate survival. (C) Clinical aGVHD scoring in untreated (No Rx, n = 11), CTLA4-Ig (n = 4), sirolimus (n = 6), and FR104 (n = 3) cohorts on day 7. GI aGVHD scores from FR104/sirolimus recipients with documented enteric infections were censored. Data are shown as mean ± SEM. Statistical analysis was performed using 1-way ANOVA with Holm-Šidák multiple-comparison post test. (D) Clinical aGVHD scoring in the following cohorts, each at terminal analysis: untreated (No Rx, n = 11), CTLA4-Ig (n = 4), sirolimus (n = 6), FR104 (n = 3), FR104/sirolimus recipients undergoing terminal analysis before day 66 (n = 6), FR104/sirolimus recipients undergoing terminal analysis after day 66 (n = 3), CTLA4-Ig/sirolimus (n = 7), and autologous controls (n = 3). Data are shown as mean ± SEM. Statistical analysis was performed using 1-way ANOVA with Holm-Šidák multiple comparison post test. (E) Terminal aGVHD histopathologic scores. The scores shown represent the total score for the skin, liver, and GI tract (83). GI aGVHD scores from FR104/sirolimus recipients with documented enteric infections were censored. Data are shown as mean ± SEM. Statistical analysis was performed using 1-way ANOVA with Holm-Šidák multiple-comparison post test. *P < 0.05; **P < 0.01; ***P < 0.001.
Figure 3
Figure 3. GSEA comparing FR104 versus CTLA4-Ig as monoprophylaxis.
(A) GSEA showing a representative enrichment plot of naive T cell–related gene sets comparing T cells isolated from the FR104 cohort at day 14 (n = 3) and T cells isolated from the No Rx cohort at terminal analysis (n = 11). (B) GSEA showing underrepresented traces of cell proliferation–, antigen-dependent T cell maturation–, and effector differentiation–related gene sets between the FR104 cohort at day 14 (n = 3) and the No Rx cohort at terminal analysis (n = 11). (C) GSEA showing representative enrichment plots of cell proliferation–, antigen-dependent T cell maturation–, and effector differentiation–related gene sets between the FR104 cohort at day 14 (n = 3) and the HC cohort (n = 56). (D) GSEA showing underrepresentation of CTLA4-KO–related genes in the FR104 (n = 3) versus CTLA4-Ig (n = 4) comparison at day 14. (E) GSEA showing enrichment of a representative naive T cell signaling pathway in the FR104 (n = 3) versus CTLA4-Ig monoprophylaxis (n = 4) comparison. (F) GSEA showing underrepresented traces of cell cycle, effector T cell, antigen response, and cytotoxicity gene sets in a comparison of FR104 (n = 3) versus CTLA4-Ig (n = 4) cohorts at day 14. FDR for each of these comparisons corresponds to q < 0.05.
Figure 4
Figure 4. Impact of FR104 and FR104/sirolimus on T cell proliferation and effector differentiation.
(A) The percentage of Ki-67hi and GZMBveryhi within CD4+ and CD8+ T cell populations in the No Rx (n = 11), CTLA4-Ig (n = 4), sirolimus (n = 6), FR104 (n = 3), FR104/sirolimus (n = 9), and CTLA4-Ig/sirolimus (n = 7) cohorts. Data are shown as mean ± SEM. *P < 0.05 between the indicated groups and the FR104/sirolimus cohort using the Holm-Šidák–corrected t test. (B) The percentage of Ki-67hi and GZMBveryhi CD8+ T cells in tissues at terminal analysis in the HC (n = 3), No Rx (n = 10), sirolimus (n = 4), FR104 (n = 3), and FR104/sirolimus (sacrificed before day 66, n = 6; or after day 66, n = 3) cohorts. Data are shown as mean ± SEM. Bars represent statistically significant differences between groups, with *P < 0.05 using the Holm-Šidák–corrected t test. (C) The relative number of CD45RA+CCR7+CD95 naive CD4+ or CD8+ T cells, normalized to the corresponding pretransplant level in No Rx (n = 11), CTLA4-Ig (n = 4), sirolimus (n = 6), FR104 (n = 3), FR104/sirolimus (n = 9), and CTLA4-Ig/sirolimus (n = 7) cohorts. Data are shown as mean ± SEM. TN, naive T cells. (D) The relative number of CD45RA+CCR7+CD95 naive CD4+ or CD8+ T cells before and after discontinuation of FR104 in FR104/sirolimus cohort recipients who survived for more than 66 days (R.249, R.250, and R.251). Each line represents a single experiment. Statistical analysis was performed using the paired Student’s t test. (E) Representative GSEA plots. The top and middle panels represent proliferation-related and antigen-dependent immune activation gene sets, respectively. These transcripts are underrepresented in the FR104/sirolimus cohort on day 14 (n = 7) compared with FR104 (n = 3) and sirolimus monoprophylaxis (n = 4) cohorts at terminal analysis (FDR q < 0.05). Bottom panel represents naive T cell–related gene sets which are overrepresented in the FR104/sirolimus cohort on day 14 (n = 7) compared with FR104 (n = 3) and sirolimus monoprophylaxis (n = 4) cohorts at terminal analysis (FDR q < 0.05). (F) The relative expression of LAG3, PDCD1 (encoding PD-1), CTLA4, HAVCR2 (Tim3), and CD244 (2B4) transcripts. Horizontal significance bars denote comparisons with a moderated t statistic of *P < 0.05, corrected for multiple testing using the Benjamini-Hochberg method.
Figure 5
Figure 5. FR104/sirolimus synergistically modulates T cell effector and proliferative transcriptional signals dysregulated during aGVHD.
(A) Top panel: number of genes DE in the FR104 (n = 3; at day 14), sirolimus (n = 4; at terminal analysis), and FR104/sirolimus (n = 6; at day 14) cohorts compared with the No Rx cohort at terminal analysis. Each bar represents the number of DE genes that are unique for each comparison. Bottom panel: number of genes DE in the CTLA4-Ig (n = 3; at day 14), sirolimus (n = 4; at terminal analysis), and CTLA4-Ig/sirolimus (n = 6; at day 14) cohorts compared with the No Rx cohort at terminal analysis. Each bar represents the number of DE genes that are unique for each comparison. (B) Venn diagram showing the number of genes uniquely DE in either the FR104/sirolimus or the CTLA4-Ig/sirolimus cohorts compared with the No Rx cohort and the degree of overlap between these 2 DE gene lists. Red text depicts the number of overrepresented transcripts; blue text depicts the number of underrepresented transcripts. (C) Functional characterization of pathways enriched in both the overrepresented and underrepresented genes, defined as shown in B: underrepresented genes unique for FR014/sirolimus vs. No Rx comparison (left); overrepresented genes unique for FR014/sirolimus vs. No Rx comparison (middle); and underrepresented genes shared between FR104/sirolimus vs. NoRx and CTLA4-Ig/sirolimus vs. NoRx comparisons (right). A complete list of the individual pathways identified is found in Supplemental Table 5. Pathway identification used a Benjamini-Hochberg–corrected P value of less than 0.05. (D) Representative GSEA underrepresented plots of cell cycle– and immune response–related gene sets and an overrepresented naive T cell–related gene set in the FR104/sirolimus (n = 6) transcriptome in comparison with the CTLA4-Ig/sirolimus transcriptome (n = 6; transcriptomes derived from T cells isolated at day 28 from both cohorts) with FDR of q < 0.05.
Figure 6
Figure 6. Unsupervised systems analysis demonstrates the unique transcriptomic profile associated with FR104/sirolimus.
(A) Topological overlap matrix plot with associated hierarchical clustering tree and the resulting gene modules from a weighted network of T cell transcripts using the transcriptomes of the No Rx (n = 11), HC (n = 56), CTLA4-Ig/sirolimus (n = 6), and FR104/sirolimus (n = 8) cohorts. The lists of genes encapsulating each module are shown in Supplemental Table 6. (B) Eigengene adjacency heatmap showing module eigengene similarity to each of the NHP clinical cohorts.
Figure 7
Figure 7. Visualization of the blue gene module.
(A) Visualization of gene coexpression network connections between the most connected genes in the blue module using Cytoscape. Shown are nodes with network connections whose topological overlap is above a threshold of 0.1. Edges with network connections above the threshold of 0.25 are shown. Mean expression fold change values of the FR104/sirolimus cohort versus HC for each gene are visualized using a false-color scale. Pathways were then identified using the DAVID database, using a cutoff derived from the Benjamini-Hochberg statistic. P < 0.05. In addition, 7 representative submodules containing genes from the top statistically ranking pathways (enumerated with the Reactome Database) are shown. (B) Functional distribution of all pathways enriched in the blue module. A complete list of the individual pathways identified is found in Supplemental Table 7. Pathway identification used a Benjamini-Hochberg–corrected P value of < 0.05.
Figure 8
Figure 8. Visualization of the brown gene module.
Visualization of the gene coexpression network connections between the most connected genes in the brown module using Cytoscape. Shown are nodes with network connections whose topological overlap is above a threshold of 0.1. Edges with network connections above the threshold of 0.1 are shown. Mean expression fold change values of the FR104/sirolimus cohort versus HC for each gene are visualized using a false-color scale.
Figure 9
Figure 9. The impact of FR104/sirolimus on Treg homeostasis after transplant.
(A) The relative number (percentage of total CD4 T cells; top panel), the absolute number (middle panel), and the Treg/100 Tconv ratio, normalized to the corresponding pretransplant values (bottom panel) were tracked longitudinally by flow cytometry in the No Rx (n = 7), sirolimus (n = 6), FR104 (n = 3), FR104/sirolimus (n = 9), and CTLA4-Ig/sirolimus (n = 7) cohorts. Tregs were defined as CD3+CD4+CD25+CD127loFoxP3+; Tconv cells were defined as CD3+CD8+ and CD3+CD4+CD25CD127hi by flow cytometric analysis. Data are shown as mean ± SEM. The solid red threshold line represents the Treg/100 Tconv ratio in the No Rx cohort at terminal analysis (62), with dotted lines above and below the threshold line representing the SEM interval. (B) The relative number (percentage of total CD4+ T cells) of Tregs in the peripheral (axillary and inguinal) LNs and spleen in HC animals and recipients from KY1005/sirolimus undergoing terminal analysis before or after day 66. (C) The normalized Treg/100 Tconv ratio (left panel) and the percentage of CD28+CD4+ T cells (right panel) before (white circles) and after (black circles) discontinuation of FR104 in FR104/sirolimus cohort recipients who survived more than 66 days after transplant (R.249, R.250, and R.251). Each line represents a single experiment.
Figure 10
Figure 10. Transplant-associated events in the FR104/sirolimus cohort.
(A) Donor chimerism in the peripheral blood, bone marrow aspirate samples, and flow cytometrically sorted peripheral blood granulocytes and T and B lymphocytes, measured by microsatellite analysis (12, 62, 84) (plotted on the left y axes) and the ANC (plotted on the right y axes) in FR104/sirolimus recipients who survived more than 50 days after transplant. (B) Kaplan-Meier plot showing the relative number of hematologically engrafted recipients in FR104/sirolimus (n = 9) and CTLA4-Ig/sirolimus (n = 7) cohorts. (C) Overall survival curves of FR104/sirolimus (n = 9) and CTLA4-Ig/sirolimus (n = 7) cohorts. The Kaplan-Meier product-limit method was used to calculate survival. (D) The concentrations of IFN-γ, IL-1RA, IL-6, and IL-12 in serum samples from recipients from the No Rx, sirolimus, FR104, and FR104/sirolimus cohorts. Each line represents a single transplant recipient. Gray boxes above the graph provide the timing of infectious transplant-related events observed in the FR104/sirolimus cohort.

Similar articles

Cited by

References

    1. Jagasia M, et al. Risk factors for acute GVHD and survival after hematopoietic cell transplantation. Blood. 2012;119(1):296–307. doi: 10.1182/blood-2011-06-364265. - DOI - PMC - PubMed
    1. Lee SJ, et al. High-resolution donor-recipient HLA matching contributes to the success of unrelated donor marrow transplantation. Blood. 2007;110(13):4576–4583. doi: 10.1182/blood-2007-06-097386. - DOI - PubMed
    1. Shaw PJ, et al. Outcomes of pediatric bone marrow transplantation for leukemia and myelodysplasia using matched sibling, mismatched related, or matched unrelated donors. Blood. 2010;116(19):4007–4015. doi: 10.1182/blood-2010-01-261958. - DOI - PMC - PubMed
    1. Wagner JE, Thompson JS, Carter SL, Kernan NA, Unrelated Donor Marrow Transplantation Trial Effect of graft-versus-host disease prophylaxis on 3-year disease-free survival in recipients of unrelated donor bone marrow (T-cell Depletion Trial): a multi-centre, randomised phase II-III trial. Lancet. 2005;366(9487):733–741. doi: 10.1016/S0140-6736(05)66996-6. - DOI - PubMed
    1. Rizzo JD, et al. Recommended screening and preventive practices for long-term survivors after hematopoietic cell transplantation: joint recommendations of the European Group for Blood and Marrow Transplantation, Center for International Blood and Marrow Transplant Research, and the American Society for Blood and Marrow Transplantation (EBMT/CIBMTR/ASBMT) Bone Marrow Transplant. 2006;37(3):249–261. doi: 10.1038/sj.bmt.1705243. - DOI - PubMed

Publication types

MeSH terms