. 2018 Sep 19;46(16):8385-8403.
doi: 10.1093/nar/gky692.

In vivo genome-wide binding interactions of mouse and human constitutive androstane receptors reveal novel gene targets

Affiliations

In vivo genome-wide binding interactions of mouse and human constitutive androstane receptors reveal novel gene targets

Ben Niu et al. Nucleic Acids Res. .

Abstract

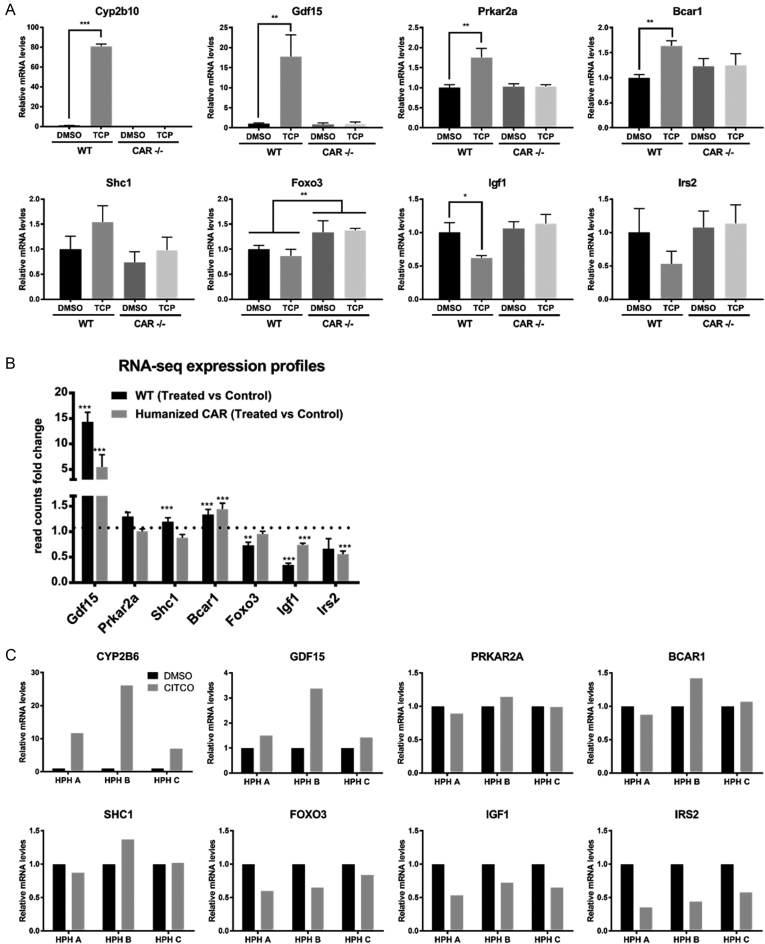
The constitutive androstane receptor (CAR; NR1I3) is a nuclear receptor orchestrating complex roles in cell and systems biology. Species differences in CAR's effector pathways remain poorly understood, including its role in regulating liver tumor promotion. We developed transgenic mouse models to assess genome-wide binding of mouse and human CAR, following receptor activation in liver with direct ligands and with phenobarbital, an indirect CAR activator. Genomic interaction profiles were integrated with transcriptional and biological pathway analyses. Newly identified CAR target genes included Gdf15 and Foxo3, important regulators of the carcinogenic process. Approximately 1000 genes exhibited differential binding interactions between mouse and human CAR, including the proto-oncogenes, Myc and Ikbke, which demonstrated preferential binding by mouse CAR as well as mouse CAR-selective transcriptional enhancement. The ChIP-exo analyses also identified distinct binding motifs for the respective mouse and human receptors. Together, the results provide new insights into the important roles that CAR contributes as a key modulator of numerous signaling pathways in mammalian organisms, presenting a genomic context that specifies species variation in biological processes under CAR's control, including liver cell proliferation and tumor promotion.


Figures

Figure 1.
Figure 1.
Adenovirus delivery of YFP-CAR constructs into CAR -/- mice. (A) Scheme of AV delivery system. Each AV YFP-CAR fusion construct was injected into CAR -/- mice 4 days prior to terminal surgery. CAR activator treatments were initiated 24 h and again at 2 h before liver extraction. (B) Fluorescence imaging of liver cryostats in AV infected mice. All samples were treated with PB. DAPI staining was performed for nuclei visualization. Upper panels show anti-YFP immunohistochemistry merged with DAPI in YFP-mCAR infected mice. Lower panels show cryostat imaging of YFP fluorescence merged with DAPI in YFP-hCAR infected mice. (C) qRT-PCR analysis of mice liver mRNA levels. Left: YFP expression levels of YFP-mCAR and YFP-hCAR infected mice were compared to WT mice (3). Student t-tests were performed for each sample versus WT untreated. Right: Expression of Cyp2b10 compared to both untreated WT mice and YFP-empty infected CAR -/-. The data shown are the average from three biological replicates normalized to Gapdh. Student t-tests were performed for each sample versus WT untreated. (D) Nuclear lysate western blot of mice liver. Adenovirus containing YFP-empty, YFP-mCAR and YFP-hCAR constructs infected CAR -/- mice through tail-vein injection. All three samples were treated with PB prior to harvest. In anti-YFP blotting, size differences between YFP-empty, YFP-mCAR and YFP-hCAR constructs could be visualized. All samples were obtained from mice treated with 75 mg/kg PB.
Figure 2.
Figure 2.
Genomic profiling of CAR using ChIP-exo. (A) Visualization of CAR enrichment on selected genes. IGV displayed YFP-CAR proteins with their direct/indirect activator binding locations on selected known CAR binding genes: Cyp2b10 (upper left), Gstm2 and Gstm3 (upper right), and Ces2a (lower left). Mapped reads were separated by strands, with forward strand reads on the upper track (red) and reverse strand reads on the bottom track (blue). From top track to bottom track: hCAR PB, hCAR CITCO, mCAR PB, mCAR TCPOBOP and the Refseq gene track. Track length is 20 kb. (B) Peak distance to TSS plot showing relative distribution of CAR binding peaks to TSS.
Figure 3.
Figure 3.
Differential analysis between mCAR and hCAR binding profiles. (A) Pearson correlation analysis for all replicates. Correlation coefficients between mCAR and hCAR replicates were much lower than replicates within the same species, indicating species variances in the respective genomic profiles. (B) PCA analysis for all replicates. Teal dots represent hCAR replicates, orange dots represent mCAR replicates. PCA analysis showed clear separation between mCAR and hCAR replicates. (C) Hierarchy cluster analysis. 1,048 significant mCAR versus hCAR differential binding loci are shown in the clustering. Clustering for all replicates indicated species variation, and consistency within each species. (D) Summary of differential binding loci associated genes. Approximately 1,000 genes exhibit differential mCAR and hCAR binding loci, whereas relatively few genes exhibit variation comparing direct vs indirect activation for hCAR or mCAR replicates. (E) IPA disease and function analysis for mCAR and hCAR differential binding associated genes. The top 10 disease and function terms are shown, ranked by p-value.
Figure 4.
Figure 4.
Gene annotation for mCAR and hCAR binding regions. (A) Venn diagram for total mCAR annotated genes and hCAR annotated genes. Annotated mCAR binding genes (n = 2,839) exhibit 2,661 genes that overlap with hCAR binding genes (n = 6,364). Binding peaks were annotated to the nearest gene TSS within ±10 kb region. (B) GO biological process analysis for the top 500 mCAR and hCAR binding genes. Top 10 GO biological process terms from DAVID GO DIRECT analysis are listed. mCAR and hCAR GO analysis indicated that the top binding genes for CAR are enriched in metabolic pathways, particularly in oxidation-reduction such as cytochrome P450, and lipid metabolism and glucose metabolism.
Figure 5.
Figure 5.
mRNA expression analysis indicates that CAR regulates key genes associated with hepatic carcinogenesis. (A) qRT-PCR assay of selected genes with respect to their mRNA expression levels in mouse liver. qRT-PCR results showed that selected genes exhibit mRNA expression level perturbation in a mCAR dependent manner. Error bars represented standard deviation of biological replicates (n = 3) in each treatment. p-values were calculated by a two-sided Student's t test. (B) RNA-seq examination of selected genes. RNA-seq validated selected genes expression changes in WT mice. Shc1, Prkar2a and Foxo3 expression did not exhibit perturbations in humanized CAR mice. Each column represents the fold-change value calculated by DESeq2, between treated (n = 3) and untreated (n = 3) samples. Asterisks (*) indicate p-values from DESeq2 analysis. (C) Realtime PCR assay of selected genes mRNA level expression in human primary hepatocytes. Realtime PCR showing selected gene mRNA expression changes for three human primary hepatocyte donors. GDF15, IGF1 IRS2 and FOXO3 all showed remarkable trend changes consistent with their mouse ortholog genes.
Figure 6.
Figure 6.
mRNA expression analysis of CAR-linked oncogenes and tumor repressor genes with species variations. (A) qRT-PCR assay of selected genes mRNA level expression in mouse liver. qRT-PCR mRNA expression analysis showed that selected genes exhibiting species variation in binding were perturbed significantly in WT mice but not in CAR -/- mice. Error bars represent standard deviation of biological replicates (n = 3) in each treatment. p-values were calculated by a two-sided student t test. (B) RNA-seq showing mRNA expression species variations of selected genes. All selected genes show significant expression changes in WT mice with no significant changes in hCAR-TG mice, indicating species variation at the transcription level in the rodent model. Each column represents a fold-change value, calculated by DESeq2 comparing treated (n = 3) and untreated (n = 3) samples. Asterisks (*) indicate p-values from DESeq2. (C) qRT-PCR assay of selected genes mRNA level expression in HPH. qRT-PCR showing selected gene mRNA expression changes within HPH. Due to the limited availability of human donor specimens, statistical evaluation of the data was not conducted.
Figure 7.
Figure 7.
Motif analysis for hCAR and mCAR. (A) hCAR and mCAR motifs from the top 500 primary binding sites. The top 500 primary binding sites clearly illustrated two hexamer half-sites DR4 structural motifs for mCAR, whereas hCAR exhibited only one hexamer. Motifs and 2-bits motif logos were generated using MEME suites. Four-color plot represents ±50bp genome sequences, centered on the top 500 primary binding sites. The color scheme for the four-color plot is the same as with motif logos. (B) hCAR and mCAR motifs from the top 1000 primary binding sites. mCAR and hCAR motifs from the top 1000 primary binding sites were very similar, with the mCAR motif degenerated to one hexamer half-site. (C) Motifs characterization of mCAR and hCAR differential binding sites. Differential binding sites analysis revealed that hCAR has high preference for single hexamer motifs, whereas mCAR preferred a complete two half-sites structure. (D) Motif comparison between direct / indirect activators. Binding motifs resulting from direct- or indirect-activated CAR were largely equivalent for both mCAR and hCAR, indicating that different modes of receptor activation do not appear to alter CAR binding profiles.
Figure 8.
Figure 8.
Visualization of selected genes and putative motif locations. (A) IGV screenshots showing differential binding peaks and putative motif locations. CAR binding regions on Myc and Ikbke are shown using IGV, indicating preferential binding of mCAR on peaks highlighted by red rectangles. Mapped reads are separated by strands, with forward strand reads on the upper track (green) and reverse strand reads on the bottom track (red). From top to bottom tracks: hCAR, mCAR, Refseq gene and putative mCAR motif locations using FIMO default settings. Track heights are normalized according to mCAR and hCAR total reads number within peaks. Genome tracks are 10k in length. (B) IGV screenshots showing peaks and putative motif locations on Gdf15. Four putative motif locations by FIMO are indicated with red arrows. (C) Putative mCAR motifs and their coordinates. q-values were calculated by FIMO. The mCAR motif logo from top 500 primary binding sites is shown on top of the putative binding sequences.

Similar articles

Cited by

References

    1. Krasowski M.D., Yasuda K., Hagey L.R., Schuetz E.G.. Evolutionary selection across the nuclear hormone receptor superfamily with a focus on the NR1I subfamily (vitamin D, pregnane X, and constitutive androstane receptors). Nucl. Recept. 2005; 3:2. - PMC - PubMed
    1. Steinmetz A.C., Renaud J.P., Moras D.. Binding of ligands and activation of transcription by nuclear receptors. Annu. Rev. Biophys. Biomol. Struct. 2001; 30:329–359. - PubMed
    1. Kojetin D.J., Matta-Camacho E., Hughes T.S., Srinivasan S., Nwachukwu J.C., Cavett V., Nowak J., Chalmers M.J., Marciano D.P., Kamenecka T.M. et al. . Structural mechanism for signal transduction in RXR nuclear receptor heterodimers. Nat. Commun. 2015; 6:8013. - PMC - PubMed
    1. Dussault I., Lin M., Hollister K., Fan M., Termini J., Sherman M.A., Forman B.M.. A structural model of the constitutive androstane receptor defines novel interactions that mediate ligand-independent activity. Mol. Cell. Biol. 2002; 22:5270–5280. - PMC - PubMed
    1. Omiecinski C.J., Coslo D.M., Chen T., Laurenzana E.M., Peffer R.C.. Multi-species analyses of direct activators of the constitutive androstane receptor. Toxicol. Sci. 2011; 123:550–562. - PMC - PubMed

Publication types

MeSH terms