. 2019 Feb;69(2):666-683.
doi: 10.1002/hep.30213. Epub 2018 Nov 19.

Bile Microinfarcts in Cholestasis Are Initiated by Rupture of the Apical Hepatocyte Membrane and Cause Shunting of Bile to Sinusoidal Blood

Affiliations

Bile Microinfarcts in Cholestasis Are Initiated by Rupture of the Apical Hepatocyte Membrane and Cause Shunting of Bile to Sinusoidal Blood

Ahmed Ghallab et al. Hepatology. 2019 Feb.

Erratum in

  • Letter to the editor.
    Pallocca G. Pallocca G. Arch Toxicol. 2019 Jun;93(6):1771. doi: 10.1007/s00204-019-02472-z. Epub 2019 May 13. Arch Toxicol. 2019. PMID: 31087121 Free PMC article. No abstract available.

Abstract

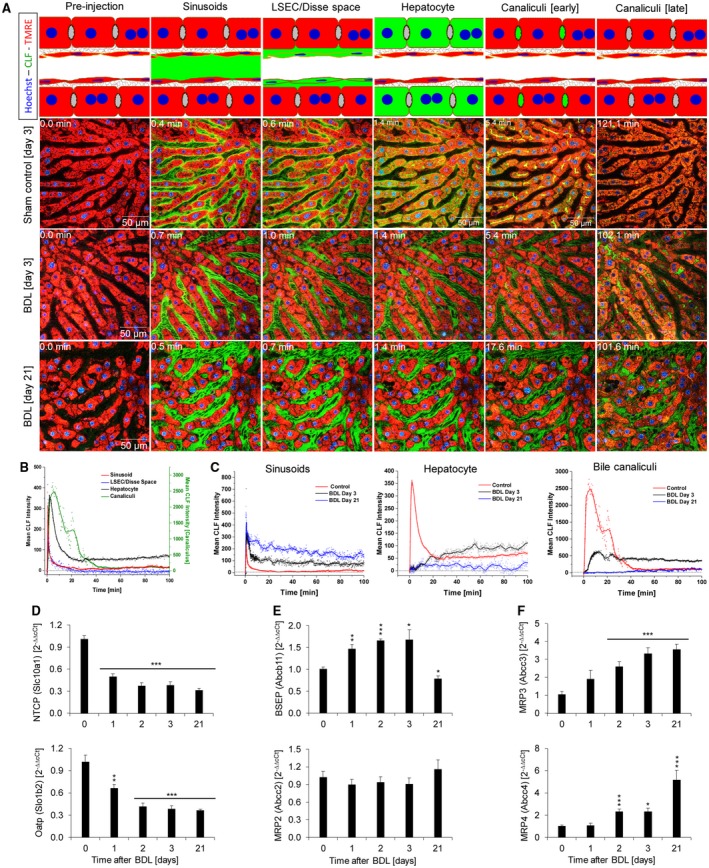
Bile duct ligation (BDL) is an experimental procedure that mimics obstructive cholestatic disease. One of the early consequences of BDL in rodents is the appearance of so-called bile infarcts that correspond to Charcot-Gombault necrosis in human cholestasis. The mechanisms causing bile infarcts and their pathophysiological relevance are unclear. Therefore, intravital two photon-based imaging of BDL mice was performed with fluorescent bile salts (BS) and non-BS organic anion analogues. Key findings were followed up by matrix-assisted laser desorption ionization imaging, clinical chemistry, immunostaining, and gene expression analyses. In the acute phase, 1-3 days after BDL, BS concentrations in bile increased and single-cell bile microinfarcts occurred in dispersed hepatocytes throughout the liver caused by the rupture of the apical hepatocyte membrane. This rupture occurred after loss of mitochondrial membrane potential, followed by entry of bile, cell death, and a "domino effect" of further death events of neighboring hepatocytes. Bile infarcts provided a trans-epithelial shunt between bile canaliculi and sinusoids by which bile constituents leaked into blood. In the chronic phase, ≥21 days after BDL, uptake of BS tracers at the sinusoidal hepatocyte membrane was reduced. This contributes to elevated concentrations of BS in blood and decreased concentrations in the biliary tract. Conclusion: Bile microinfarcts occur in the acute phase after BDL in a limited number of dispersed hepatocytes followed by larger infarcts involving neighboring hepatocytes, and they allow leakage of bile from the BS-overloaded biliary tract into blood, thereby protecting the liver from BS toxicity; in the chronic phase after BDL, reduced sinusoidal BS uptake is a dominant protective factor, and the kidney contributes to the elimination of BS until cholemic nephropathy sets in.


Conflict of interest statement

Dr. Kuepfer is employed by Bayer. Dr. Jansen advises Intercept and NGM. He is on the speakers’ bureau for Falk.

Figures

Figure 1
Figure 1
Morphological alterations after BDL. (A) Gross pathology with “black” (days 1‐3) and “white” (day 21) bile in the gallbladder; bile infarcts as pale regions in hematoxylin and eosin–stained slides (days 1‐3); infiltration of CD45‐positive leukocytes into bile infarcts and periportal fields; ductular response as evidenced by CK‐19 immunostaining (days 3‐21); periportal fibrosis visualized by sirius red (day 21). (B) Intravital imaging of mouse livers on day 3 after sham operation or BDL after intravenous injection of the green fluorescent bile salt analogue CLF; red indicates mitochondrial membrane potential visualized by TMRE; blue indicates nuclei (Hoechst 33258). Abbreviations: C, column of CLF‐enriching hepatocytes; G, clusters of CLF‐enriching hepatocytes; H&E, hematoxylin and eosin; S, single CLF‐enriching hepatocyte.
Figure 2
Figure 2
Reduced hepatic uptake of CLF after BDL. (A) Mice at 3 and 21 days post‐BDL as well as sham‐operated controls received intravenous injections of CLF. Subsequently, CLF is seen in the sinusoids, liver sinusoidal endothelial cells/Disse space, cytoplasm of hepatocytes, and bile canaliculi of controls (upper panel). At day 3 post‐BDL (middle panel) uptake of CLF through the sinusoidal membrane is strongly reduced, but export to the bile canaliculus is still active. At day 21 after BDL sinusoidal CLF uptake is blocked to such a degree that almost no increase of green fluorescence can be detected in hepatocytes and in bile canaliculi. (B) Quantification of mean CLF intensity in a control liver. (C) Mean CLF intensity 3 and 21 days post‐BDL in sinusoids, hepatocytes, and bile canaliculi in comparison to sham‐operated controls. (D‐F) Expression changes of carriers of BS and CLF at different time intervals after BDL. (D) Basolateral uptake carriers. (E) Apical export carriers. (F) Basolateral export carriers. Data are mean values and standard errors of five mice per time point. *P < 0.5, **P < 0.01, ***P < 0.001 compared to controls. Abbreviation: LSEC, liver sinusoidal endothelial cell.
Figure 3
Figure 3
Leakiness of the apical hepatocyte membrane. (A) Stills of two‐photon videos of mouse livers on day 3 post‐BDL after intravenous injection of CLF. The video focuses on a TMRE‐negative hepatocyte that is still PI‐negative. Only little CLF is taken up by the sinusoidal membrane of the TMRE‐negative hepatocyte when CLF enters the sinusoids. As soon as CLF occurs in the bile canaliculi, the TMRE‐negative hepatocyte massively takes up green fluorophore. (B) Quantification of the video shown in (A). (C) Quantification of green fluorescence after intravenous injection of CMFDA into control and day 3 post‐BDL mice, from videos shown in Supporting Fig. S5B, showing that filling of TMRE‐negative hepatocytes coincides with filling of bile canaliculi. (D) CLF uptake in TMRE‐negative hepatocytes that are either PI‐negative or PI‐positive. While PI‐positive cells take up CLF simultaneously with the sinusoids, PI‐negative cells fill later, when canaliculi become positive. During the imaging period PI‐negative cells become PI‐positive with the consequence that CLF is taken up also by the sinusoidal side. (E) CLF uptake through the sinusoidal membrane of a TMRE‐negative, PI‐positive hepatocyte. (F,G) Quantifications of the videos shown in (D) and (E).
Figure 4
Figure 4
Rupture of the apical hepatocyte membrane in the acute phase after BDL. (A) Stills of intravital imaging of mouse liver on day 1 post‐BDL after intravenous injection of CLF. Note the relatively short time between first signs of canalicular swelling (55.25 minutes) and CLF inflow into the cytoplasm of hepatocytes (57.25 minutes). (B) Release of CLF into the sinusoid from a CLF‐loaded hepatocyte. (C) Nuclear fragmentation illustrated by segmentation of the CLF‐enriching hepatocyte from (B). (D) Quantification of the video shown in (B), to illustrate increased CLF intensity in the sinusoid that is in contact with the CLF‐overloaded cell. (E) Stills from processed videos with segmented CD45 and TMRE‐positive immune cells at the moment of (115 minutes) and after (247 minutes) apical membrane rupture. (F) Time‐resolved quantification of the number of immune cells in the imaged view field illustrating that massive immune cell infiltration occurs only after apical membrane rupture and coincides with nuclear fragmentation. (G) No influence of CLF injection on bile flow. (H) Domino effect of bile infarct formation starting from individual dispersed CLF‐loaded hepatocytes. Abbreviations: MovAVG, moving average; PBS, phosphate‐buffered saline.
Figure 5
Figure 5
MALDI imaging of taurocholate in livers after BDL. (A) Transient increase of taurocholate after BDL. Superimposed MALDI images and CK‐19 immunostaining are shown. In controls the taurocholate signal is limited to the bile ducts in periportal fields. It extends to almost the entire liver lobules until day 2 and returns to levels slightly above controls until day 21 post‐BDL. The highest taurocholate signal can be seen in the infarct regions (*). (B) Quantifications of the taurocholate signal in (A). Data are mean values and standard errors of three mice per time point. *P < 0.05, **P < 0.01 compared to controls; ## P < 0.01 compared to day 21 post‐BDL. Abbreviation: AU, arbitrary units.
Figure 6
Figure 6
Clinical chemistry at several time periods after BDL. Data are mean values and standard errors of three to five mice per time point. *P < 0.05, **P < 0.01, ***P < 0.001 compared to controls; # P < 0.05, ## P < 0.01, ### P < 0.001 compared to day 21 post‐BDL.
Figure 7
Figure 7
Comparison of bile flux in Mdr2–/– and BDL mice. (A) Gross pathology, histology, ductular reaction (CK‐19), immune cell infiltration (CD45), and fibrosis (sirius red) in 18‐week‐old Mdr2–/– mice and age‐matched wild‐type controls. (B) Transiently CLF‐enriching individual hepatocytes in Mdr2–/– mice. (C) Quantification of CLF and TMRE‐associated fluorescence in the hepatocyte indicated by a white circle in (B). (D) Quantification of CLF intensity in sinusoids, hepatocytes, and bile canaliculi after CLF bolus injection. (E) Total BS concentrations in blood of BDL and Mdr2–/– and corresponding wild‐type mice of different ages. (F) Morphology of bile canaliculi in WT, Mdr2–/–, and day 3 post‐BDL mice. (G‐J) CLF intensities after bolus injection in sinusoids, hepatocytes, canaliculi, and interlobular bile ducts of wild‐type, Mdr2–/–, and day 21 post‐BDL mice. After BDL, TMRE (red) appears in the lumen of the interlobular bile ducts, a phenomenon that was not seen in Mdr2–/– or in wild‐type mice. Abbreviations: BA, bile acid; H&E, hematoxylin and eosin; WT, wild type.
Figure 8
Figure 8
Concept of bile infarcts. (A) Rupture of the apical hepatocyte membrane and (B) systemic consequences. Abbreviation: BR, bilirubin.

Comment in

Similar articles

Cited by

References

    1. Jansen PL, Ghallab A, Vartak N, Reif R, Schaap FG, Hampe J, et al. The ascending pathophysiology of cholestatic liver disease. Hepatology 2017;65:722‐738. - PubMed
    1. Fickert P, Pollheimer MJ, Beuers U, Lackner C, Hirschfield G, Housset C, et al. Characterization of animal models for primary sclerosing cholangitis (PSC). J Hepatol 2014;60:1290‐1303. - PMC - PubMed
    1. Masyuk TV, Ritman EL, LaRusso NF. Quantitative assessment of the rat intrahepatic biliary system by three‐dimensional reconstruction. Am J Pathol 2001;158:2079‐2088. - PMC - PubMed
    1. Vartak N, Damle‐Vartak A, Richter B, Dirsch O, Dahmen U, Hammad S, et al. Cholestasis‐induced adaptive remodeling of interlobular bile ducts. Hepatology 2016;63:951‐964. - PMC - PubMed
    1. Harnoss JC, Heidecke CD, Vollmar B, Eipel C. In vivo imaging of bile accumulation and biliary infarction after common bile duct ligation in rats. Eur Surg Res 2011;47:240‐247. - PubMed

Publication types

Substances