. 2018 Oct;7(19):e1800602.
doi: 10.1002/adhm.201800602. Epub 2018 Aug 13.

Enhancing Osteosarcoma Killing and CT Imaging Using Ultrahigh Drug Loading and NIR-Responsive Bismuth Sulfide@Mesoporous Silica Nanoparticles

Affiliations

Enhancing Osteosarcoma Killing and CT Imaging Using Ultrahigh Drug Loading and NIR-Responsive Bismuth Sulfide@Mesoporous Silica Nanoparticles

Yao Lu et al. Adv Healthc Mater. 2018 Oct.

Erratum in

Abstract

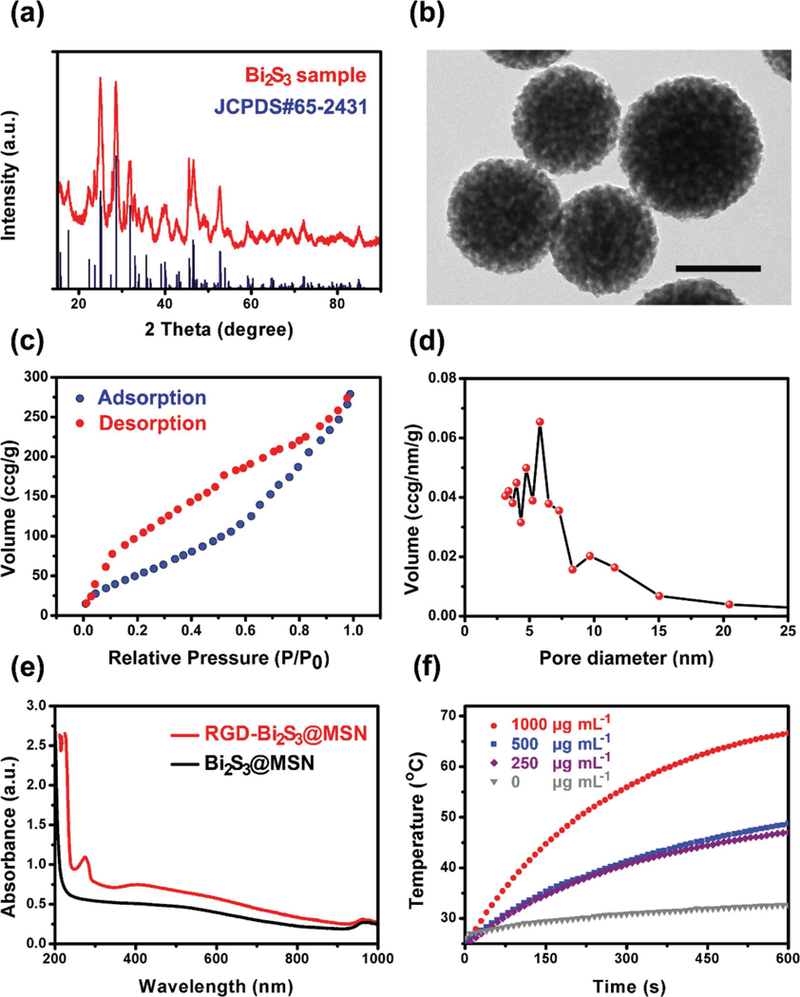
Despite its 5-year event-free survival rate increasing to 60-65% due to surgery and chemotherapy, osteosarcoma (OS) remains one of the most threatening malignant human tumors, especially in young patients. Therefore, a new approach that combines early diagnosis with efficient tumor eradication and bioimaging is urgently needed. Here, a new type of mesoporous silica-coated bismuth sulfide nanoparticles (Bi2 S3 @MSN NPs) is developed. The well distributed mesoporous pores and large surface areas hold great promise for drug protection and encapsulation (doxorubicin (DOX), 99.85%). Moreover, the high photothermal efficiency of Bi2 S3 @MSNs (36.62%) offers great possibility for cancer synergistic treatment and highly near-infrared-triggered drug release (even at an ultralow power density of 0.3 W cm-2 ). After covalently conjugated to arginine-glycine-aspartic acid (RGD) peptide [c(RGDyC)], the NPs exhibit a high specificity for osteosarcoma and finally accumulate in the tumor cells (tenfold more than peritumoral tissues) for computed tomography (CT) imaging and tumor ablation. Importantly, the synergistic photothermal therapy-chemotherapy of the RGD-Bi2 S3 @MSN/DOX significantly ablates the highly malignant OS. It is further proved that the superior combined killing effect is achieved by activating the mitochondrial apoptosis pathway. Hence, the smart RGD-Bi2 S3 @MSN/DOX theranostic platform is a promising candidate for future applications in CT monitoring and synergistic treatment of malignant tumors.

Keywords: Bi2S3@MSN; X-ray computed tomography; mitochondrial apoptosis pathway; osteosarcoma; photothermal therapy-chemotherapy.


Conflict of interest statement

Conflict of Interest

The authors declare no conflict of interest.

Figures

Figure 1.
Figure 1.
Characterization of the Bi2S3@MSN. a) XRD spectra of the Bi2S3 NPs and the JCPDS standard for Bi2S3. b) TEM image of the Bi2S3@MSN. Scale bar = 100 nm. c) Nitrogen adsorption/desorption isotherms. d) Pore size distribution. e) UV–vis–NIR absorption spectrum of the Bi2S3@MSN and RGD–Bi2S3@MSN, the RGD–Bi2S3@MSNs exhibit a new peak in 270 nm, indicating the successful conjugation of RGD. f) Quantitative temperature change of Bi2S3@MSN different concentrations under 1 W cm–2 808 nm laser irradiation.
Figure 2.
Figure 2.
NIR-triggered release of DOX from Bi2S3@MSN at varied power densities. a) Illustration of drug release behavior with or without NIR laser irradiation. Burst drug release occurred after applying NIR laser irradiation. b) Photothermal conversion efficiency (η) of the NPs. Changes in drug release and temperature under c) 0.3 W cm–2, d) 0.5 W cm–2, e) 1 W cm–2, f) and 0 W cm–2 NIR irradiation.
Figure 3.
Figure 3.
In vitro active targeting effect of the RGD–Bi2S3@MSN. a) Fluorescence images ofUMR-106 cells cocultured with free FITC, FITC–Bi2S3@MSN, and FITC–RGD–Bi2S3@MSN. b) Flow cytometry analysis of UMR-106 cells stained by the free FITC, FITC–Bi2S3@MSN, and FITC–RGD–Bi2S3@MSN. c) Quantitative analysis of fluorescence intensity of different groups in (b). Scale bar = 50 μ.m. Each value is the mean ± standard deviation (n = 3 in each group); *p < 0.05, **p < 0.01, ***p < 0.001 compared to the control group.
Figure 4.
Figure 4.
Biocompatibility and tumor cells killing effect in vitro. a) Cell viability of UMR-106 cells cocultured with different Bi2S3@MSN concentrations for 24 h. b) Hemolysis test of human RBCs exposed to the different concentrations of Bi2S3@MSN. The inset figure shows the picture of the centrifuge tubes after centrifugation. (+) represents the purified water, (–) represents the PBS solution. c) Tumor cells killing effect of different groups. The RGD–Bi2S3@MSN/DOX+NIR exhibited the most significantly killing effect. d) Fluorescence microscopy images of live/dead dye-stained UMR-106 cells after co-cultured with different NPs and treatment with or without 808 nm (1 W cm–2) NIR irradiation. Scale bar = 50 μ.m. e) Effects of different treatments on the express levels of Bcl-2 and caspase-3 proteins in UMR-106 cells after cocultured for 24 h using western blot. Each value is the mean ± standard deviation (n = 3 in each group); *p < 0.05, **p < 0.01, ***p < 0.001 compared to the control group.
Figure 5.
Figure 5.
CT imaging performance of the NPs. a) In vitro CT value (HU) of Bi2S3@MSN and iobitridol. Inset: CT images of the Bi2S3@MSN and iobitridol suspensions with different concentrations. b) In vivo CT images of UMR-106 tumor-bearing nude mice recorded at 2 and 24 h after i.v. injection of the RGD–Bi2S3@MSN and Bi2S3@MSN (dosage: 200 of Bi2S3@MSN (5 mg kg–1)). The tumor site is highlighted by the red circle.
Figure 6.
Figure 6.
In vivo therapy effect of different treatment groups. a) NIR photothermal images of UMR-106 bearing nude mice after i.v. injection of RGD–Bi2S3@MSN and Bi2S3@MSN. b) Quantitative temperature change of the tumor site from (a). c) Representative images of tumor bearing mice from different treatment groups. d) Images of tumor collected from tumor bearing mice with different treatment. e) Tumor volume growth curves of different treatment groups. f) Body weight changes in different treatment groups. Each value is the mean ± standard deviation (n = 4 in each group); *p < 0.05, **p < 0.01, ***p < 0.001 compared to the control group.
Figure 7.
Figure 7.
Histological study and western blot. a) H&E staining of tumors collected from different treatments. b) Effects of RGD–Bi2S3@MSN/DOX, RGD–Bi2S3@MSN+NIR, and RGD–Bi2S3@MSN/DOX+NIR on Bcl-2 and caspase-3 protein expression in tumor tissues using western blot. c) H&E staining of main organs in different treatment groups.
Scheme 1.
Scheme 1.
The smart RGD-Bi2S3@MSN/DOX nanoplatform for OS real-time X-ray CT imaging and NIR-responsive photothermal therapy-chemotherapy.

Similar articles

Cited by

References

    1. Kansara M, Teng MW, Smyth MJ, Thomas DM, Nat. Rev Cancer 2014, 14, 722. - PubMed
    1. Fujiwara T, Ozaki T, Stem Cells Int. 2016, 2016, 1. - PMC - PubMed
    1. Ma H, Jiang C, Zhai D, Luo Y, Chen Y, Lv F, Yi Z, Deng Y, Wang J, Chang J, Adv. Funct. Mater. 2016, 26, 1197.
    1. Jaque D, Martinez Maestro L, del Rosal B, Haro-Gonzalez P, Benayas A, Plaza JL, Martin Rodriguez E, Garcia Sole J, Nanoscale 2014, 6, 9494. - PubMed
    1. a) Kuo W-S, Chang C-N, Chang Y-T, Yang M-H, Chien Y-H, Chen S-J, Yeh C-S, Angew. Chem. 2010, 122, 2771; - PubMed
    2. b) Ren F, Bhana S, Norman DD, Johnson J, Xu L, Baker DL, Parrill AL, Huang X, Bioconjugate Chem. 2013, 24, 376. - PubMed

Publication types