. 2019 Feb;69(2):545-563.
doi: 10.1002/hep.30215. Epub 2019 Jan 4.

Macrophage-Specific Hypoxia-Inducible Factor-1α Contributes to Impaired Autophagic Flux in Nonalcoholic Steatohepatitis

Affiliations

Macrophage-Specific Hypoxia-Inducible Factor-1α Contributes to Impaired Autophagic Flux in Nonalcoholic Steatohepatitis

Xiaojing Wang et al. Hepatology. 2019 Feb.

Abstract

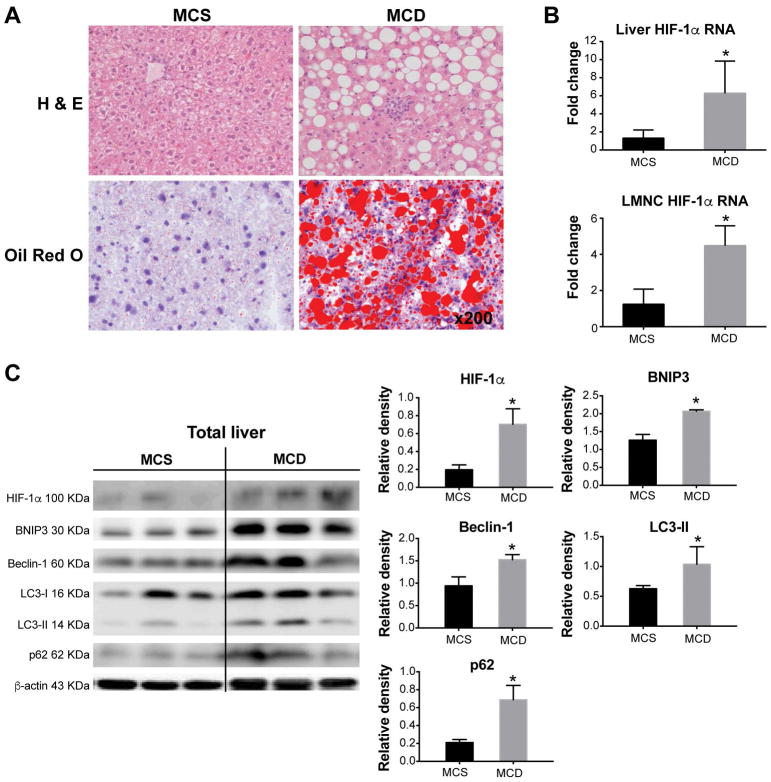
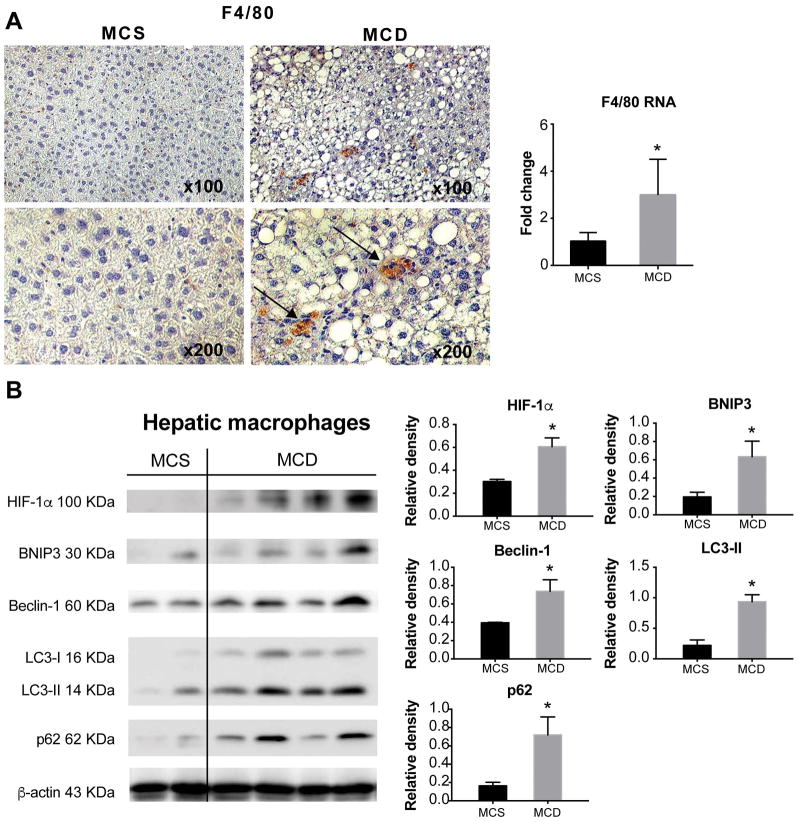
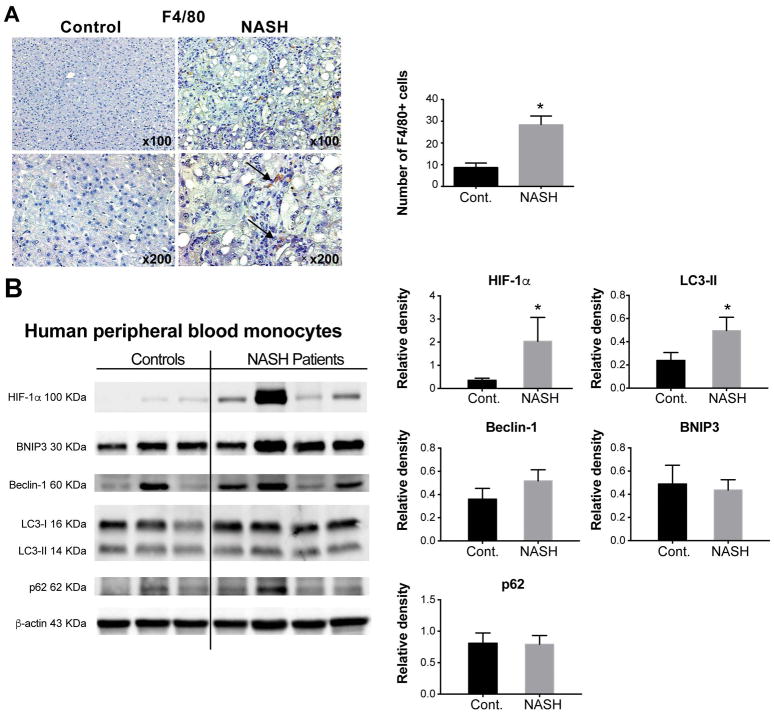
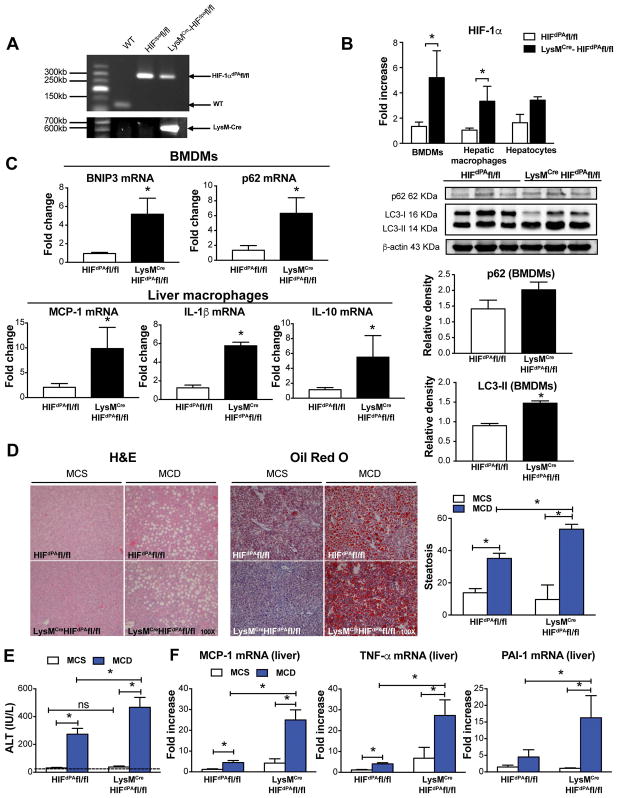
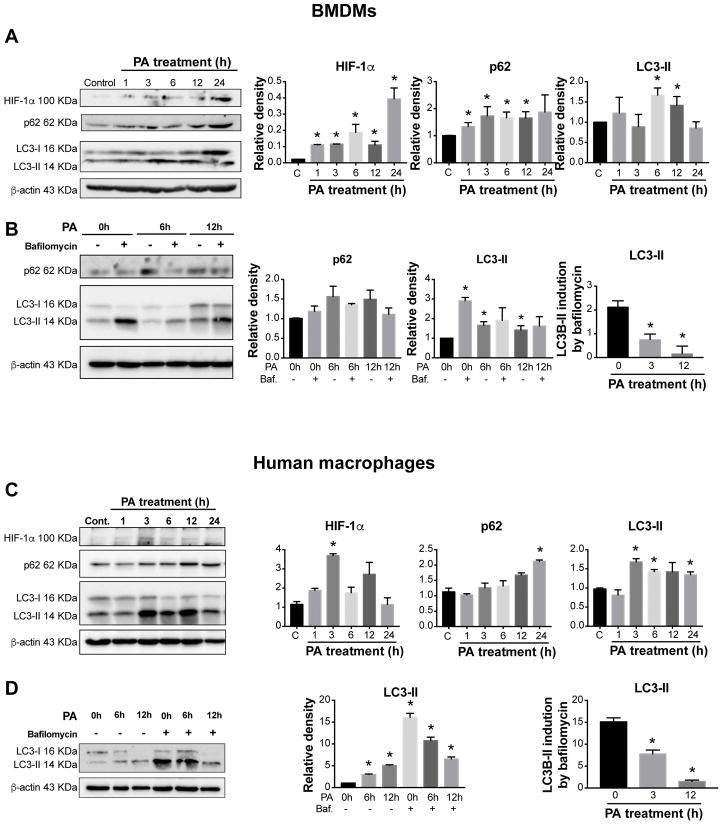
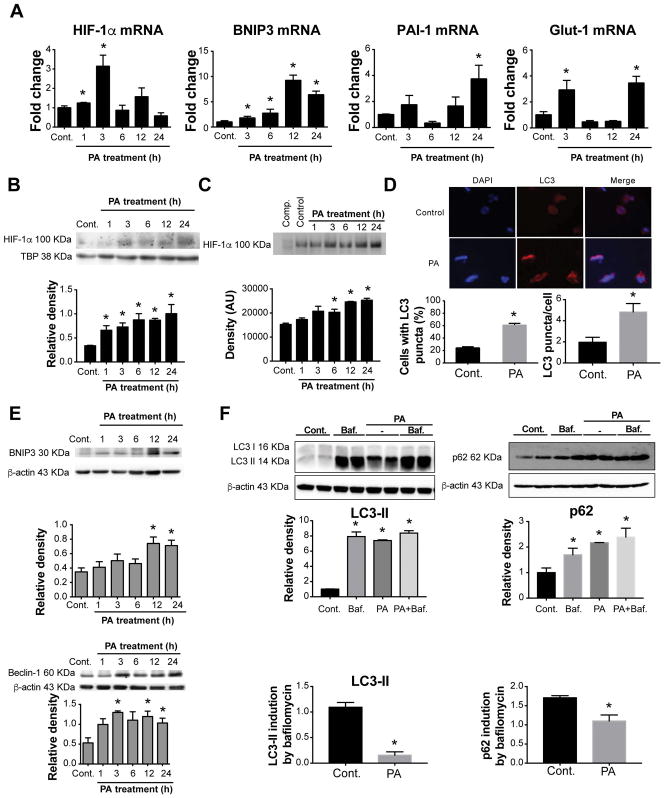
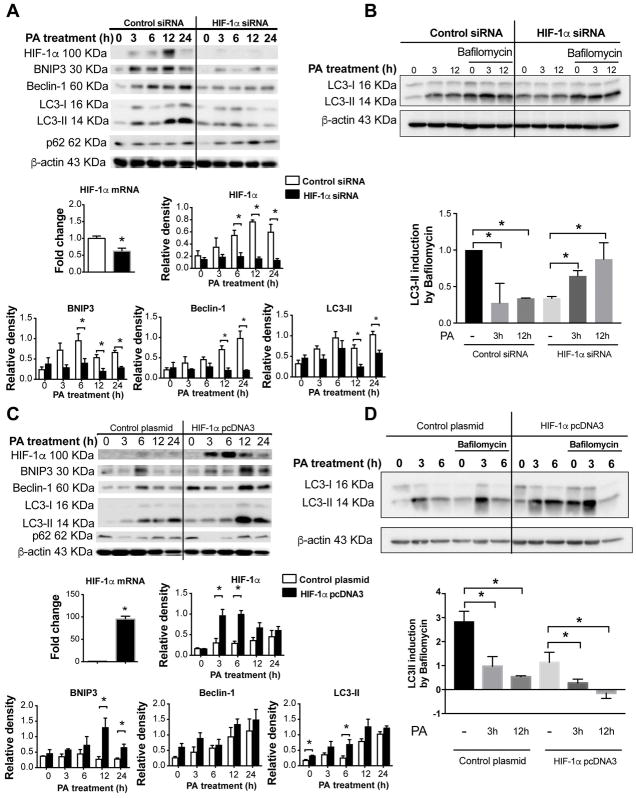
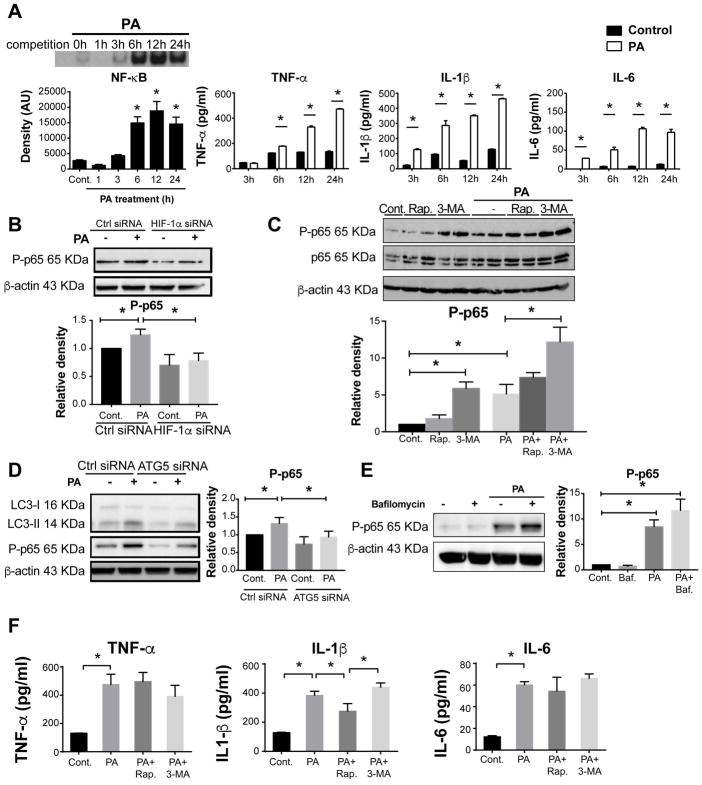
Inflammatory cell activation drives diverse cellular programming during hepatic diseases. Hypoxia-inducible factors (HIFs) have recently been identified as important regulators of immunity and inflammation. In nonalcoholic steatohepatitis (NASH), HIF-1α is upregulated in hepatocytes, where it induces steatosis; however, the role of HIF-1α in macrophages under metabolic stress has not been explored. In this study, we found increased HIF-1α levels in hepatic macrophages in methionine-choline-deficient (MCD) diet-fed mice and in macrophages of patients with NASH compared with controls. The HIF-1α increase was concomitant with elevated levels of autophagy markers BNIP3, Beclin-1, LC3-II, and p62 in both mouse and human macrophages. LysMCre HIFdPA fl/fl mice, which have HIF-1α levels stabilized in macrophages, showed higher steatosis and liver inflammation compared with HIFdPA fl/fl mice on MCD diet. In vitro and ex vivo experiments reveal that saturated fatty acid, palmitic acid (PA), both induces HIF-1α and impairs autophagic flux in macrophages. Using small interfering RNA-mediated knock-down and overexpression of HIF-1α in macrophages, we demonstrated that PA impairs autophagy via HIF-1α. We found that HIF-1α mediates NF-κB activation and MCP-1 production and that HIF-1α-mediated impairment of macrophage autophagy increases IL-1β production, contributing to MCD diet-induced NASH. Conclusion: Palmitic acid impairs autophagy via HIF-1α activation in macrophages. HIF-1α and impaired autophagy are present in NASH in vivo in mouse macrophages and in human blood monocytes. We identified that HIF-1α activation and decreased autophagic flux stimulate inflammation in macrophages through upregulation of NF-κB activation. These results suggest that macrophage activation in NASH involves a complex interplay between HIF-1α and autophagy as these pathways promote proinflammatory overactivation in MCD diet-induced NASH.


Figures

Figure 1
Figure 1. HIF-1α increases in total liver in MCD diet-fed mice and is associated with decreased autophagic flux
Wild-type C57BL/6 mice were fed an MCD or MCS diet for 8 weeks. (A) Liver sections were stained with H&E or Oil-Red-O to assess liver injury and steatosis. (B) RNA isolated from either total liver or liver mononuclear cells (LMNC) was used to measure HIF-1α expression by qPCR. (C) The protein levels of HIF-1α, BNIP3, Beclin-1, LC3-II and p62 in total liver were assessed by western blot, quantified using ImageJ analysis and normalized to β-actin. Mice experiments are representative of 3–10 mice per experimental group. *P<0.05.
Figure 2
Figure 2. Hepatic macrophages of MCD diet-fed mice have increased HIF-1α and decreased autophagic flux
Liver sections from MCD or MCS diet-fed mice were subjected to F4/80 immunohistochemistry (black arrows indicate the F4/80 positive cells), the F4/80 RNA levels were measured by qPCR in corresponding liver samples. (B) The protein levels of HIF-1α, BNIP3, Beclin-1, LC3-II and p62 were assessed in isolated hepatic macrophages by western blot. Image density was quantified using ImageJ analysis and normalized to β-actin. Mice experiments are representative of 3–10 mice per experimental group. *P<0.05.
Figure 3
Figure 3. HIF-1α increases in both hepatic macrophages and circulating monocytes in NASH patients and correlates with autophagy
Liver tissues and blood samples were collected from either NASH patients or healthy controls. (A) Liver sections were subjected to F4/80 immunohistochemistry (black arrows indicate the F4/80 positive cells). The total number of F4/80-positive cells from five high-powered fields was counted per liver section by microscopy. At least three liver sections were included in each group. (B) Circulating monocytes were isolated from blood samples, the protein levels of HIF-1α, BNIP3, Beclin-1, LC3 I, LC3 II and P62 in monocytes were assessed by western blot, quantified using ImageJ analysis and normalized to beta-actin. Representative blots are shown from 10 healthy donors and 12 patients with diagnosed NASH. *P<0.05. Cont, control.
Figure 4
Figure 4. Macrophage-specific HIF-1α contributes to steatosis and liver inflammation induced by the MCD diet
LysMCreHIFdPAfl/fl mice were generated by cross-breeding LysMCre mice, which express Cre recombinase in myeloid cells under the control of the lysozyme M promoter, with HIFdPAfl/fl mice, which lacks proline hydroxylation sites for HIF degradation. (A) Genotyping analysis of the HIFdPAfl/fl and LysMCreHIFdPAfl/fl mice. (B) The mRNA levels of HIF-1α in BMDMs, hepatic macrophages, and hepatocytes from HIFdPAfl/fl and LysMCreHIFdPAfl/fl mice were measured by qRT-PCR. (C) BNIP3 and p62 mRNA levels in BMDMs and MCP-1, IL-1β, and IL-10 mRNA expression in liver macrophages were measured by qRT-PCR. LC3-II and p62 protein levels were measured by western blot, quantified using ImageJ analysis, and normalized to β-actin. (D) Liver sections were stained with H&E or Oil-Red-O to assess liver injury and steatosis. (E) ALT levels were assessed from serum samples. (F) mRNA levels of MCP-1, TNF-α and PAI-1 were measured in the total liver by qRT-PCR. Mice experiments are representative of 3–10 mice per experimental group. *P<0.05.
Figure 5
Figure 5. HIF-1α increases in BMDMs and human macrophages and correlates with decreased autophagic flux
(A) Bone marrow from WT mice was isolated, and BMDMs generated after 7 days in the presence of L929 cell supernatant. Cells were stimulated with 250 μM PA for different time points and HIF-1α, p62, and LC3-II were assessed by Western blot. (B) BMDMs were cultivated in control medium or under PA stimulation for 6 or 12 hours with or without bafilomycin (Baf, 100 nM) (added at 0h or for the last 2 hours for 6 and 12 h incubations). (C) Human monocytes from healthy volunteers were isolated and differentiated to macrophages and HIF-1α, p62, and LC3-II were assessed in PA-stimulated cells by Western blot, quantified using ImageJ analysis and normalized to β-actin. (D) LC3-II levels of human macrophages were assessed in the presence or absence of bafilomycin (100nM) (added as in B) in PA-stimulated cells. Representative blots are shown from at least three independent experiments. *P<0.05. C, control.
Figure 6
Figure 6. Palmitic acid activates HIF-1α and decreases autophagic flux in THP-1 macrophages
THP-1 cells were differentiated by 100nM PMA for 48h and treated with either 250 μM PA for the indicated time points, or BSA as a control. (A) The mRNA expression of HIF-1α and its target genes BNIP3, PAI-1 and Glut-1 were measured by qPCR. (B) Nuclear HIF-1α protein expression was measured via western blot and quantified using ImageJ analysis. (C) HIF-1α DNA-binding activity was tested and quantified using the electrophoretic mobility shift assay. (D) The detection of LC3 puncta in THP-1 cells was performed with a rabbit anti-LC3 antibody and immunofluorescence staining. THP-1 cells with more than 10 punctate dots were considered as positive cells (right), and the number and size of LC3 puncta/cell were quantified (left). Quantification of LC3-positive THP-1 cells and representative blots were performed in three independent experiments. (E) Protein levels of BNIP3 and Beclin-1 were assessed by western blot, quantified using ImageJ analysis, and normalized to β-actin. (F) Cells were cultivated in control medium or under PA stimulation for 12 hours with or without bafilomycin (Baf, 100 nM) for the last 2 hours. LC3 II and p62 protein levels were measured by western blot and quantified using ImageJ analysis. *P<0.05. Cont., control.
Figure 7
Figure 7. HIF-1α is involved in impaired autophagy in palmitic acid-stimulated THP-1 macrophages
HIF-1α mRNA and protein levels were downregulated using HIF-1α siRNA (A) or overexpressed using the HIF-1α-bearing pcDNA3 expression vector (B) in THP-1 macrophages. HIF-1α mRNA levels were assessed by qPCR. Protein levels of HIF-1α, BNIP3, Beclin-1, and LC3-II were assessed at indicated time points by western blot after transfection, quantified using ImageJ analysis and normalized to β-actin. HIF-1α siRNA (C) or overexpressed (D) THP-1 macrophages were cultivated in control medium or under PA stimulation with or without bafilomycin (100 nM) for the last 2 hours. LC3-II and P62 protein levels were measured by western blot, and the LC3-II ratio was calculated.
Figure 8
Figure 8. HIF-1α inhibits palmitic acid-induced NF-κB activation
(A) NF-κB DNA-binding activity was measured after PA stimulation at indicated time points using EMSA. TNF-α, IL-1β and IL-6 levels in the supernatants of THP-1 cells upon PA treatment were measured using an ELISA assay. (B) Phosphorylated p65 (P-p65) levels in THP-1 macrophages treated with HIF-1α siRNA were measured by western blot and quantified using ImageJ analysis. (C) Cells were pretreated for 30 min with an autophagy inducer, rapamycin (Rap, 100 nM) or inhibitor, 3-methyladenine (3-MA, 5 mM) prior to 6h-PA stimulation. Protein levels of P-p65 and P65 were measured by western blot and quantified using ImageJ analysis. (D) Cells were transfected using control or ATG5 siRNA, and P-p65 levels were measured by western blot and quantified using ImageJ analysis. (E) Cells were cultivated in control medium or under PA stimulation for 6 hours with or without bafilomycin (Baf, 100 nM) (added at 0h or for the last 2 hours for 6 and 12 h incubations), and P-p65 levels were measured by western blot. (F) TNF-α, IL-1β and IL-6 levels in the supernatants were measured by ELISA. Representative blots and ELISAs are shown from at least three independent experiments *P<0.05.

References

    1. Chitturi S, Wong VW, Farrell G. Nonalcoholic fatty liver in Asia: Firmly entrenched and rapidly gaining ground. J Gastroenterol Hepatol. 2011;26(Suppl 1):163–172. - PubMed
    1. Bugianesi E, Moscatiello S, Ciaravella MF, Marchesini G. Insulin resistance in nonalcoholic fatty liver disease. Curr Pharm Des. 2010;16:1941–1951. - PubMed
    1. Paschetta E, Belci P, Alisi A, Liccardo D, Cutrera R, Musso G, Nobili V. OSAS-related inflammatory mechanisms of liver injury in nonalcoholic fatty liver disease. Mediators Inflamm. 2015;2015:815721. - PMC - PubMed
    1. Musso G, Cassader M, Olivetti C, Rosina F, Carbone G, Gambino R. Association of obstructive sleep apnoea with the presence and severity of non-alcoholic fatty liver disease. A systematic review and meta-analysis. Obes Rev. 2013;14:417–431. - PubMed
    1. Nath B, Szabo G. Hypoxia and hypoxia inducible factors: diverse roles in liver diseases. Hepatology. 2012;55:622–633. - PMC - PubMed

Publication types