Alveolar Air and O2 Uptake During Exercise in Patients With Heart Failure
- PMID: 30103021
- PMCID: PMC6269087
- DOI: 10.1016/j.cardfail.2018.08.001
Alveolar Air and O2 Uptake During Exercise in Patients With Heart Failure
Abstract
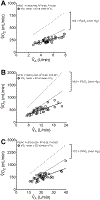
Background: Peak exercise pulmonary oxygen uptake (V̇O2) is a primary marker of prognosis in heart failure (HF). The pathophysiology of impaired peak V̇O2 is unclear in patients. To what extent alveolar airway function affects V̇O2 during cardiopulmonary exercise testing (CPET) has not been fully elucidated. This study aimed to describe how changes in alveolar ventilation (V̇A), volume (VA), and related parameters couple with exercise V̇O2 in HF.
Methods and results: A total of 35 patients with HF (left ventricular ejection fraction 20 ± 6%, age 53 ± 7 y) participated in CPET with breath-to-breath measurements of ventilation and gas exchange. At rest, 20 W, and peak exercise, arterial CO2 tension was measured via radial arterial catheterization and used in alveolar equations to derive V̇A and VA. Resting lung diffusion capacity for carbon monoxide (DLCO) was assessed and indexed to VA for each time point. Resting R2 between V̇O2 and V̇A, VA, DLCO, and DLCO/VA was 0.68, 0.18, 0.20, and 0.07, respectively (all P < .05 except DLCO/VA). 20 W R2 between V̇O2 and V̇A, VA, DLCO, and DLCO/VA was 0.64, 0.32, 0.07, and 0.18 (all P < .05 except DLCO). Peak exercise R2 between V̇O2 and V̇A, VA, DLCO, and DLCO/VA was 0.55, 0.31, 0.34, and 0.06 (all P < .05 except DLCO/VA).
Conclusions: These data suggest that alveolar airway function that is not exclusively related to effects caused by localized lung diffusivity affects exercise V̇O2 in moderate-to-severe HF.
Keywords: Aerobic exercise capacity; Exercise intolerance; HFpEF; HFrEF; Metabolic demand; O(2) transport; Oxidative capacity.
Copyright © 2018 The Author(s). Published by Elsevier Inc. All rights reserved.
Conflict of interest statement
Conflicts of interest
The authors report no relationships that could be construed as a conflict of interest.
Figures


Similar articles
-
The alveolar to arterial oxygen partial pressure difference is associated with pulmonary diffusing capacity in heart failure patients.Respir Physiol Neurobiol. 2016 Nov;233:1-6. doi: 10.1016/j.resp.2016.06.004. Epub 2016 Jul 1. Respir Physiol Neurobiol. 2016. PMID: 27374970
-
Simultaneous Measurement of Lung Diffusing Capacity and Pulmonary Hemodynamics Reveals Exertional Alveolar-Capillary Dysfunction in Heart Failure With Preserved Ejection Fraction.J Am Heart Assoc. 2021 Aug 17;10(16):e019950. doi: 10.1161/JAHA.120.019950. Epub 2021 Aug 7. J Am Heart Assoc. 2021. PMID: 34369164 Free PMC article.
-
Low resting diffusion capacity, dyspnea, and exercise intolerance in chronic obstructive pulmonary disease.J Appl Physiol (1985). 2019 Oct 1;127(4):1107-1116. doi: 10.1152/japplphysiol.00341.2019. Epub 2019 Aug 1. J Appl Physiol (1985). 2019. PMID: 31369329
-
Mechanisms of the Improvement in Peak VO2 With Exercise Training in Heart Failure With Reduced or Preserved Ejection Fraction.Heart Lung Circ. 2018 Jan;27(1):9-21. doi: 10.1016/j.hlc.2017.07.002. Epub 2017 Aug 4. Heart Lung Circ. 2018. PMID: 28870770 Review.
-
[Widening of the alveolar-arterial oxygen gradient during incremental exercise].Rev Mal Respir. 2012 Dec;29(10):1224-37. doi: 10.1016/j.rmr.2012.05.018. Epub 2012 Nov 13. Rev Mal Respir. 2012. PMID: 23228680 Review. French.
Cited by
-
Two is better than one: the double diffusion technique in classifying heart failure.ERJ Open Res. 2024 Jan 15;10(1):00644-2023. doi: 10.1183/23120541.00644-2023. eCollection 2024 Jan. ERJ Open Res. 2024. PMID: 38226067 Free PMC article.
-
All-cause mortality predicted by peak oxygen uptake differs depending on spirometry pattern in patients with heart failure and reduced ejection fraction.ESC Heart Fail. 2021 Aug;8(4):2731-2740. doi: 10.1002/ehf2.13342. Epub 2021 May 1. ESC Heart Fail. 2021. PMID: 33932128 Free PMC article.
References
-
- Balady GJ, Arena R, Sietsema K, Myers J, Coke L, Fletcher GF, et al. Clinician’s Guide to cardiopulmonary exercise testing in adults: a scientific statement from the American Heart Association. Circulation. 2010;122:191–225. - PubMed
-
- Arena R, Myers J, Aslam SS, Varughese EB, Peberdy MA. Peak VO2 and VE/VCO2 slope in patients with heart failure: a prognostic comparison. Am Heart J. 2004;147:354–60. - PubMed
-
- Weber KT, Janicki JS. Cardiopulmonary exercise testing for evaluation of chronic cardiac failure. Am J Cardiol. 1985;55:22A–31A. - PubMed
-
- Mancini DM, Eisen H, Kussmaul W, Mull R, Edmunds LH Jr., Wilson JR Value of peak exercise oxygen consumption for optimal timing of cardiac transplantation in ambulatory patients with heart failure. Circulation. 1991;83:778–86. - PubMed
-
- Puri S, Baker BL, Dutka DP, Oakley CM, Hughes JM, Cleland JG. Reduced alveolar-capillary membrane diffusing capacity in chronic heart failure. Its pathophysiological relevance and relationship to exercise performance. Circulation. 1995;91:2769–74. - PubMed
MeSH terms
Grants and funding
LinkOut - more resources
Full Text Sources
Other Literature Sources
Medical
Research Materials
Miscellaneous

