

Cellular DNA quantification in respiratory samples for the normalization of viral load: a real need?
- PMID: 30103163
- PMCID: PMC7173160
- DOI: 10.1016/j.jcv.2018.07.010
Cellular DNA quantification in respiratory samples for the normalization of viral load: a real need?
Abstract
Background: Respiratory tract infections have an enormous social economic impact, with high incidence of hospitalization and high costs. Adequate specimen collection is the first crucial step for the correct diagnosis of viral respiratory infections.
Objectives: The present retrospective study aimed: i) to verify the cell yield obtained from sampling the nasal respiratory tract using mid-turbinate flocked swabs; ii) to evaluate the normalization of viral load, based on cell number; and iii) to compare the kinetics of viral infection obtained with normalized vs non-normalized viral load.
Study design: The number of cells were quantified by real-time PCR in residual extract of nasal swabs tested for respiratory viruses detection and stored at -80 °C in a universal transport medium (UTM™).
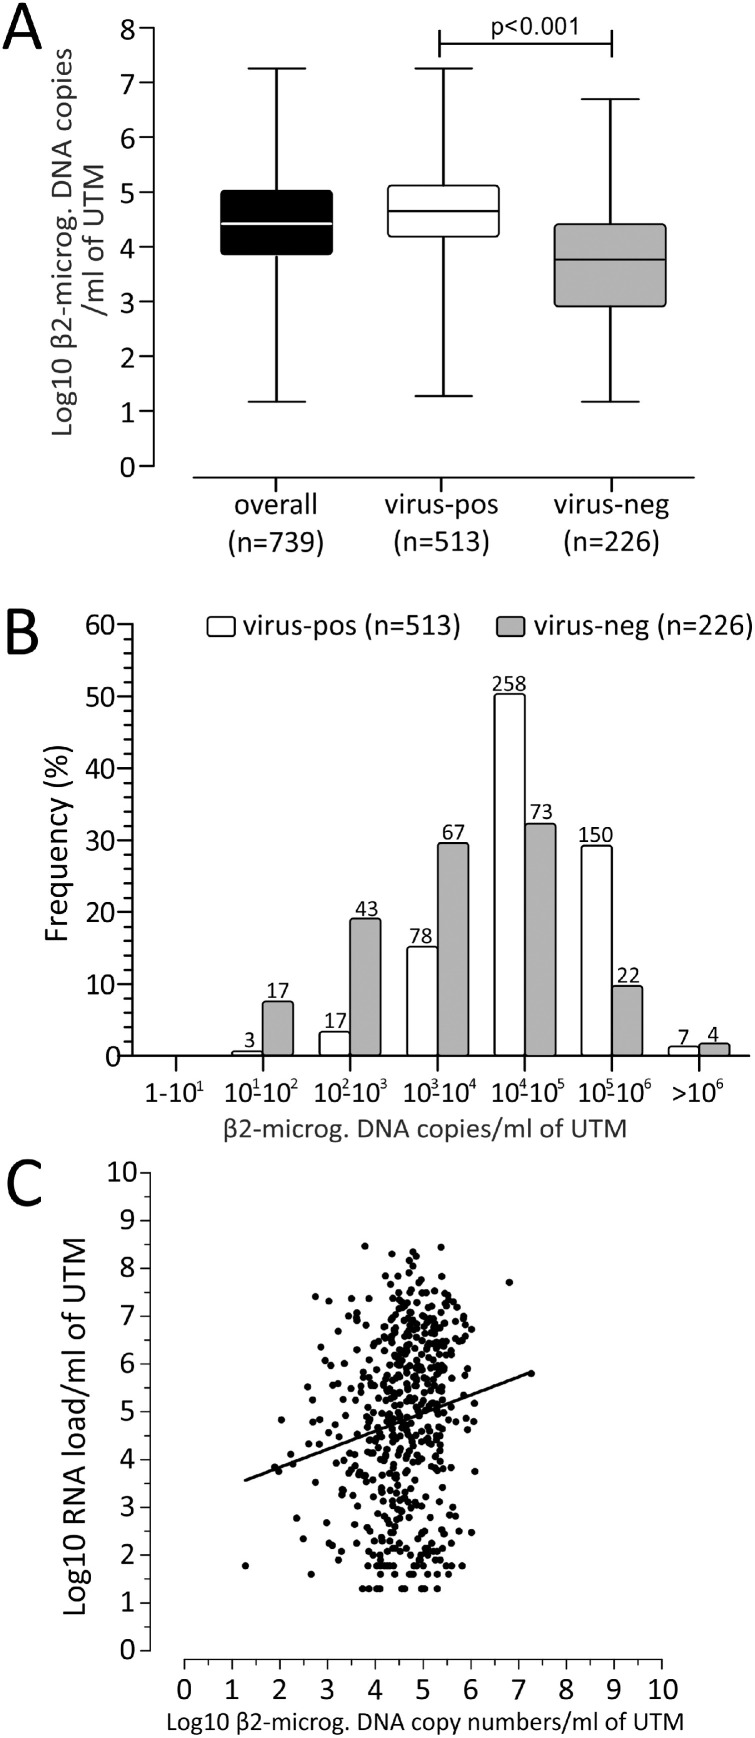
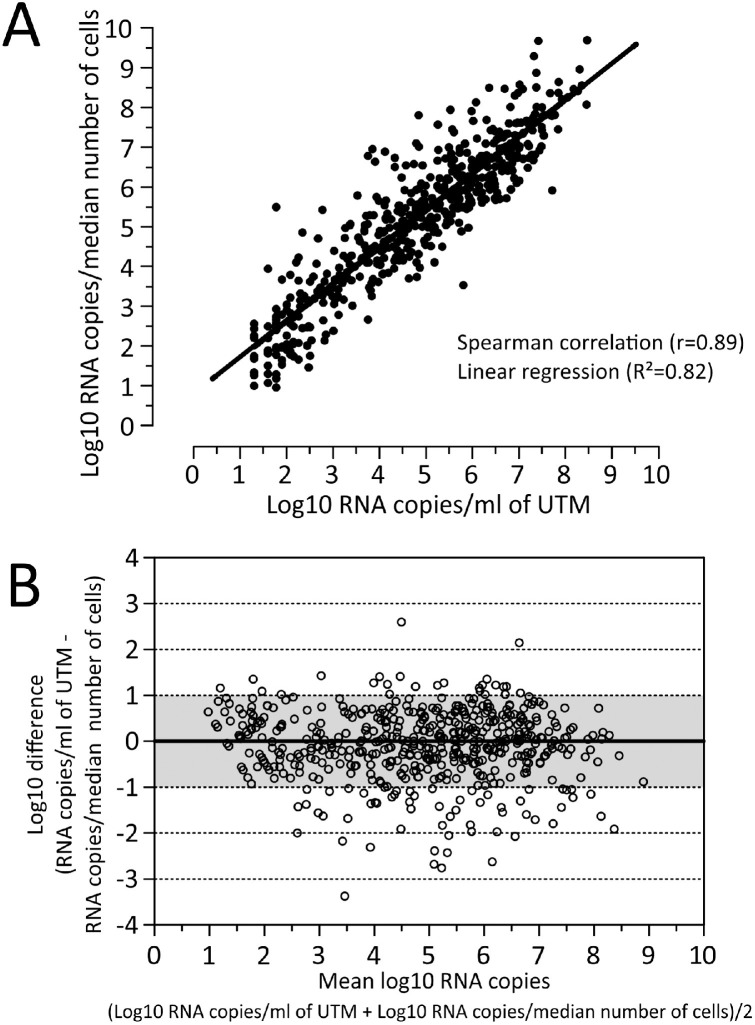
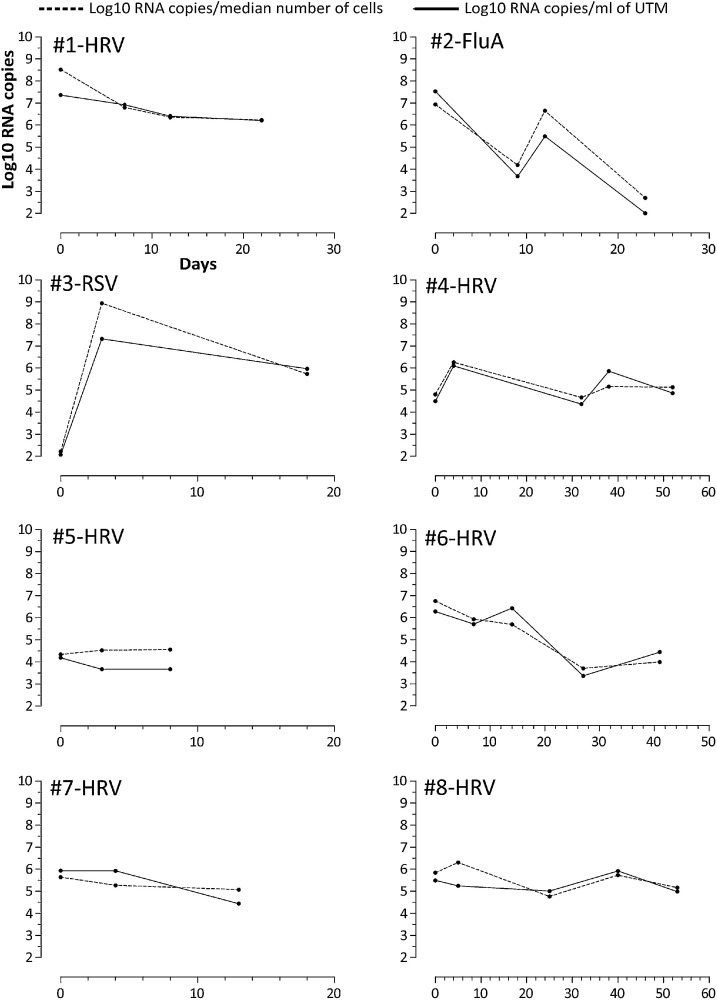
Results: A total of 513 virus-positive and 226 virus-negative samples were analyzed. Overall, a median of 4.42 log10 β2-microgolubin DNA copy number/ml of UTM™ (range 1.17-7.26) was detected. A significantly higher number of cells was observed in virus-positive as compared to virus-negative samples (4.75 vs 3.76; p < 0.001). Viral loads expressed as log10 RNA copies/ml of UTM™ and log10 RNA copies/median number of cells were compared in virus-positive samples and a strict correlation (r = 0.89, p < 0.001) and agreement (R2 = 0.82) were observed. In addition, infection kinetics were compared using the two methods with a follow-up series of eight episodes of viral infection and the mean difference was -0.57 log10 (range -1.99 to 0.40).
Conclusions: The normalization of viral load using cellular load compliments the validation of real-time PCR results in the diagnosis of respiratory viruses but is not strictly needed.
Keywords: Cell number; Flocked mid-turbinate nasal swabs; Quantification; Respiratory viruses; Viral load.
Copyright © 2018. Published by Elsevier B.V.
Figures
Similar articles
-
Evaluating addition of self-collected throat swabs to nasal swabs for respiratory virus detection.J Clin Virol. 2019 Jun;115:43-46. doi: 10.1016/j.jcv.2019.04.001. Epub 2019 Apr 4. J Clin Virol. 2019. PMID: 30978619 Free PMC article.
-
Swabbing for respiratory viral infections in older patients: a comparison of rayon and nylon flocked swabs.Eur J Clin Microbiol Infect Dis. 2011 Feb;30(2):159-65. doi: 10.1007/s10096-010-1064-2. Epub 2010 Sep 18. Eur J Clin Microbiol Infect Dis. 2011. PMID: 20853014 Free PMC article.
-
Comparison of nasopharyngeal flocked swabs and aspirates for rapid diagnosis of respiratory viruses in children.J Clin Virol. 2008 May;42(1):65-9. doi: 10.1016/j.jcv.2007.12.003. Epub 2008 Feb 1. J Clin Virol. 2008. PMID: 18242124
-
PCR for detection of respiratory viruses: seasonal variations of virus infections.Expert Rev Anti Infect Ther. 2011 Aug;9(8):615-26. doi: 10.1586/eri.11.75. Expert Rev Anti Infect Ther. 2011. PMID: 21819328 Free PMC article. Review.
-
[Virological diagnosis of lower respiratory tract infections].Rev Mal Respir. 2021 Jan;38(1):58-73. doi: 10.1016/j.rmr.2020.11.002. Epub 2021 Jan 16. Rev Mal Respir. 2021. PMID: 33461842 Review. French.
Cited by
-
Efficacy of Unsupervised Self-Collected Mid-Turbinate FLOQSwabs for the Diagnosis of Coronavirus Disease 2019 (COVID-19).Viruses. 2021 Aug 22;13(8):1663. doi: 10.3390/v13081663. Viruses. 2021. PMID: 34452527 Free PMC article.
-
Importance of Adequate qPCR Controls in Infection Control.Diagnostics (Basel). 2021 Dec 16;11(12):2373. doi: 10.3390/diagnostics11122373. Diagnostics (Basel). 2021. PMID: 34943608 Free PMC article.
-
Systematic review on the association between respiratory virus real-time PCR cycle threshold values and clinical presentation or outcomes.J Antimicrob Chemother. 2021 Sep 23;76(Suppl 3):iii33-iii49. doi: 10.1093/jac/dkab246. J Antimicrob Chemother. 2021. PMID: 34555159 Free PMC article.
-
Evaluation of SARS-CoV-2 quantification from oropharyngeal swabs, nasopharyngeal swabs, and naso-oropharyngeal swabs: A cross-sectional study.Heliyon. 2024 Mar 23;10(7):e28647. doi: 10.1016/j.heliyon.2024.e28647. eCollection 2024 Apr 15. Heliyon. 2024. PMID: 38586376 Free PMC article.
References
Publication types
MeSH terms
Substances
LinkOut - more resources
Full Text Sources
Other Literature Sources
