Review
. 2018 Aug 10;8(3):76.
doi: 10.3390/bios8030076.

Synergistic Integration of Laboratory and Numerical Approaches in Studies of the Biomechanics of Diseased Red Blood Cells

Affiliations
Review

Synergistic Integration of Laboratory and Numerical Approaches in Studies of the Biomechanics of Diseased Red Blood Cells

He Li et al. Biosensors (Basel). .

Abstract

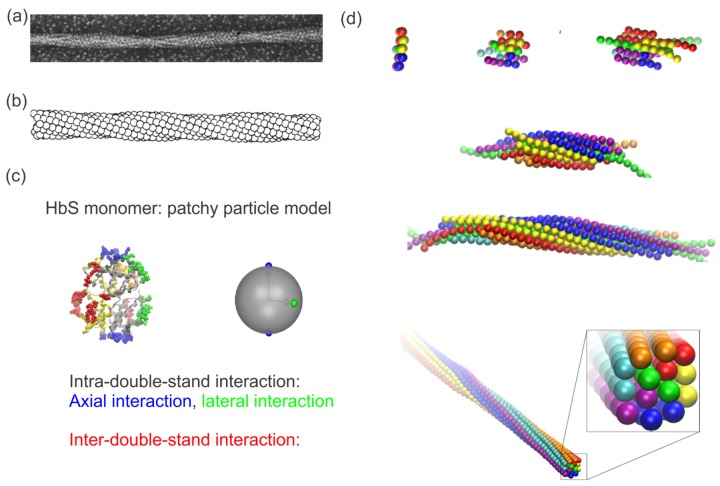
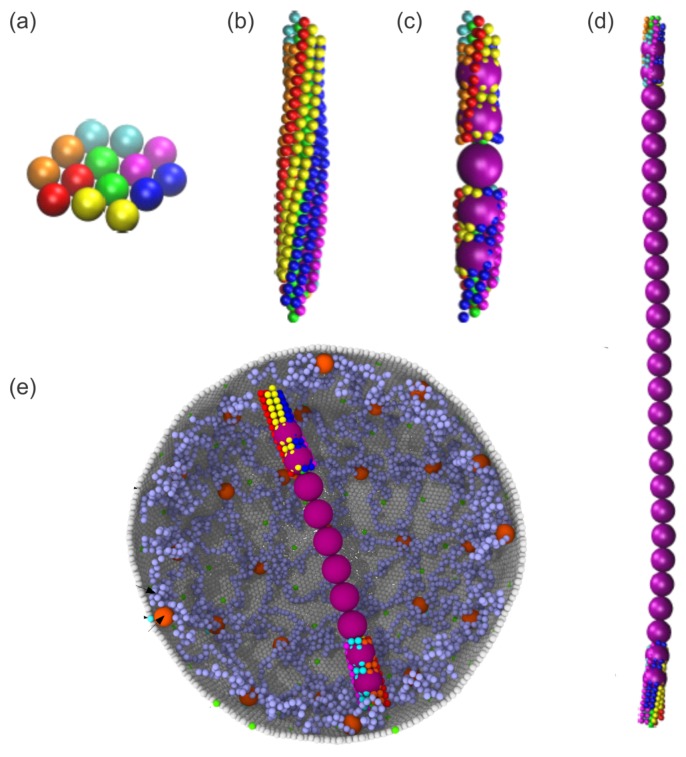
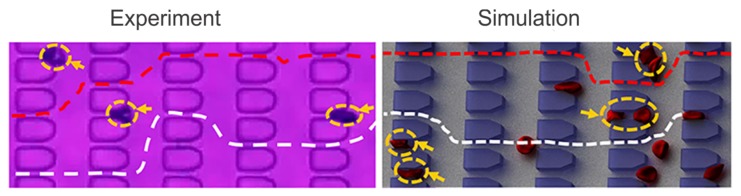
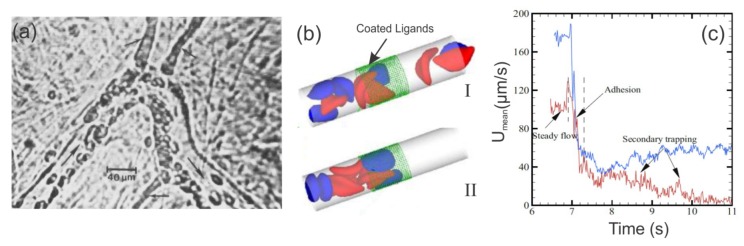
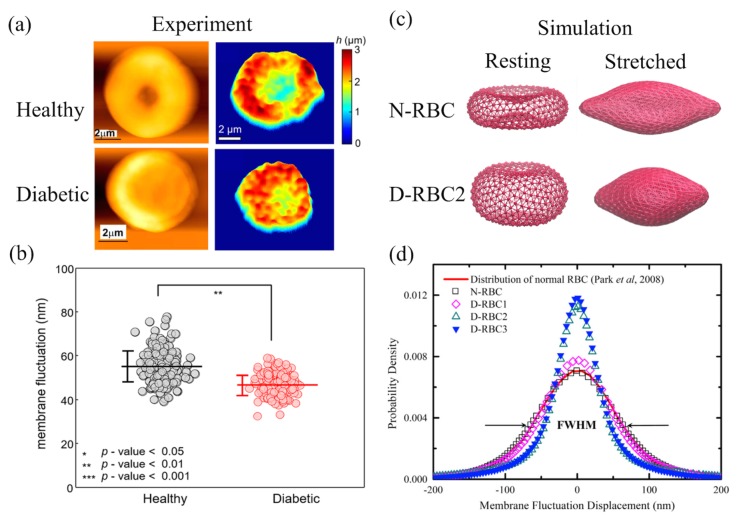
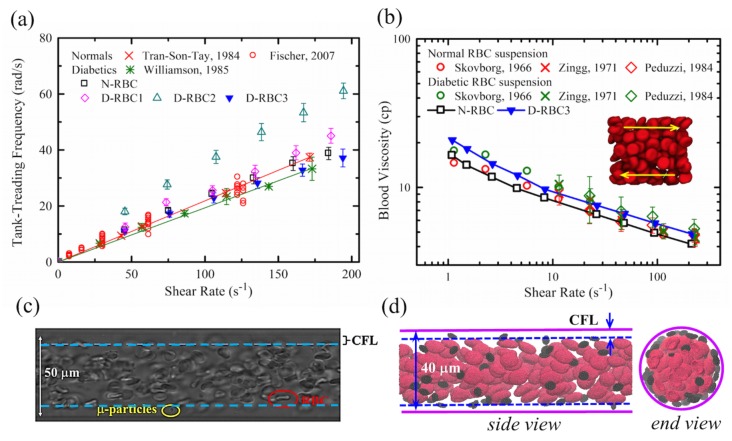
In red blood cell (RBC) disorders, such as sickle cell disease, hereditary spherocytosis, and diabetes, alterations to the size and shape of RBCs due to either mutations of RBC proteins or changes to the extracellular environment, lead to compromised cell deformability, impaired cell stability, and increased propensity to aggregate. Numerous laboratory approaches have been implemented to elucidate the pathogenesis of RBC disorders. Concurrently, computational RBC models have been developed to simulate the dynamics of RBCs under physiological and pathological conditions. In this work, we review recent laboratory and computational studies of disordered RBCs. Distinguished from previous reviews, we emphasize how experimental techniques and computational modeling can be synergically integrated to improve the understanding of the pathophysiology of hematological disorders.

Keywords: laboratory approaches; numerical modeling; red blood cell disorders.


Conflict of interest statement

The authors declare no conflict of interest.

Figures

Figure 1
Figure 1
(a) Electronic microscopy image of structure of a single sickle hemoglobin (HbS) fiber. Reproduced with permission from reference [74]. (b) Reconstruction of the HbS fiber with a sphere model. Reproduced with permission from reference [74]. (c) Mesoscopic modeling of HbS molecules (left) by patchy particles (right). Green and blue represent lateral and axial intra-double-strand contacts. Red signifies the inter-double-strand contacts. Reproduced with permission from reference [81]. (d) Sequential snapshots of HbS polymerization from a nucleus to a fiber. Reproduced with permission from reference [81].
Figure 2
Figure 2
(ad) Sequential snapshots of growth of a HbS fiber simulated by a hybrid HbS fiber model. Reproduced with permission from reference [85]. (e) Simulation of the interactions between a spherical RBC [61] and a HbS fiber using a hybrid fiber model [85].
Figure 3
Figure 3
(Left) Microfluidics device showing individual SS-RBC passage through capillary-inspired microchannels under transient hypoxia. (Right) The corresponding simulations of SS-RBCs passage through capillary-like microchannels under transient hypoxia by dissipative particle dynamics. Reproduced with permission from reference [98].
Figure 4
Figure 4
(a) SS-RBCs adhere to venular bending and to junctions of smaller diameter postcapillary venules (small arrows) in the isolated mesocecum observed by using intravital microscopy. The large arrows indicate the flow direction. Reproduced from reference[106] with permission. (b) Model of SS-RBCs flowing in capillaries. Reproduced from reference [110]. The green dotted region represents the ligands coated on the vessel wall. The blue cells represent the active group of SS-RBCs that exhibits adhesive interaction with the ligands on the wall. The red cells represent the non-active group of cells. (b. (I)) A snapshot of SS-RBCs in a non-occlusion state, showing the active and non-active cell groups flowing unobstructed within the vessel. (b.(II)) A snapshot of SS-RBCs in an occlusion state. The active (blue) cells adhere to the wall by interacting with the ligands. (c) Mean velocity as a function of time. The red and blue curves correspond to different pressure drops (red: 8.3 × 10⁴ Pa/m and blue: 1.35 × 10⁵ Pa/m). Prior to adhesion (t < 6.9 s), a steady flow state is reached within the vessel with average velocities of ∼115 μm/s (red), and ∼180 μm/s (blue). When the adhesive forces are turned on (6.9 s < t < 7.3 s), the average velocity exhibits a sharp decrease to ∼40 μm/s, and blood flow exhibits a transition from a steady flow state to a partially (blue) or even completely (red) occluded state. The velocity of the blood flow of the red curve (smaller pressure drop) decreases to ∼10 μm/s, representing the secondary entrapment of the non-active cells and the fully occluded state. Reproduced from reference [110].
Figure 5
Figure 5
Still frames of intravital microscopy showing (a) interactions between SS-RBCs (arrows) and adherent leukocytes (arrow-heads) in the venules of sickle mice and subsequent (b) venular occlusion (white asterisk). Reproduced from reference [112]. (c) In silico studies of vessel occlusion induced by inflammation-stimulated leukocytes. Instantaneous mean velocity of the blood flow in a vessel of diameter of D = 20.4 μm and Hct = 13% encompassing three leukocytes. (Insets) The green dotted region represents the coated ligands, mimicking the inflammation region of the vessel. Snapshots represent blood flow states as follows: (I) initial stage of inflammatory response and free motion of the blood flow; (II) moderate RBC-leukocyte interactions and blood flow slowdown; (III) late stage of the inflammatory response, where the RBC-leukocyte interaction is further intensified, leading to entrapment of multiple SS-RBCs on the adherent leukocytes and consequent vessel occlusion. (Inset plot) Side-by-side comparison of experiments versus simulations. The blue bars represent the blood flow velocity of the present study and the red bars represent the experimental results in reference [100], where measurements were taken on 23–41 venules with average diameters of 20.9 ± 1.3 μm and 24.9 ± 1.8 μm before and after inflammation stimulation. Reproduced from Lei et al. [110].
Figure 6
Figure 6
(A) Experimental results of simultaneous adhesion and polymerization in sickle reticulocytes under hypoxia and shear flow on a fibronectin-coated microchannel wall. (a) (t = 0) The cell adheres on the surface. (d) (t = 7.9 min) During cell adhesion, there is significant protrusion of polymerized HbS fibers (white pointers) outwards of the bulk of the cell. (b,e) Outline of the contours of the initial and final (including the HbS protrusions) snapshots of the adherent sickle reticulocyte. (c,f) Hatched sketches of the cell-wall contact area. The hatched area roughly represents the contact area of the cell’s lipid bilayer. The hatched area in snapshot (c) is approximately two times larger than the hatched area in snapshot (f). The white arrows denote the flow direction. Scale bar: 5 μm. From Papageorgiou et al. [116] with permission. (B) Simulation results of HbS polymerization within a mature sickle cell (i) versus a sickle reticulocyte (ii). The excess membrane of the sickle reticulocyte in (ii) (that has not been shed in the circulation yet through vesiculation) allows the polymerized HbS fiber projections to continue to grow outwards of the cell bulk while the membrane is simultaneously encompassing the fibers, i.e., confirming the experimental observations in (A).
Figure 7
Figure 7
(a) Optical microscopy images of peripheral blood smears of HS patients after splenectomy. Reproduced with permission from reference [119]. (b) Hypothesis for RBC membrane loss in HS proposed in reference [120]. (c) Simulations of membrane vesiculation of defective RBC membranes in HS using the coarse-grained molecular dynamics (CGMD) method. Reproduced from reference [121] with permission. (d) Simulations of a RBC passing through a narrow slit using the finite element method. Reproduced from reference [122] with permission.
Figure 8
Figure 8
(a) Trajectory of a mobile band-3 protein in an RBC membrane undergoing hop diffusion (left). Trajectory of a mobile band-3 protein in a lipid bilayer undergoing normal diffusion (right) obtained from CGMD simulations [140]. (b) Mean square displacement (MSD) of mobile band-3 proteins with varying vertical connectivities between band-3 proteins and spectrin filaments. Reproduced from reference [140] with permission.
Figure 9
Figure 9
(a) Morphological characteristics of a representative healthy red blood cell (RBC) and a diabetic RBC depicted in the AFM images (left). Reproduced from reference [150] with permission. Two-dimensional topographic height maps (right). Reproduced from reference [151] with permission. (b) Scatter plot of retrieved membrane fluctuations from RBC data in healthy and diabetic groups where the horizontal lines are the mean values of membrane fluctuations and the vertical error bars are the sample standard deviations. Reproduced from reference [151] with permission. (c) Coarse-grained models of RBCs in healthy (N-RBC) and in diabetic (D-RBC3) patients with their resting forms (left) and the stretched states under external tensile force 100 pN (right). Reproduced from reference [152] with permission. (d) Membrane fluctuation distributions of different RBC models [152]. N-RBC is a representative model for normal RBCs, while D-RBC1, D-RBC2, and D-RBC3 are three potential models for diabetes mellitus (DM) RBCs. The simulation results of N-RBC is compared with the experimental data [153] drawn in red line and FWHM is the full-width half-maximum. Reproduced from reference [152] with permission.
Figure 10
Figure 10
(a) Normal and T2DM RBC tank-treading frequency as a function of the shear rate. Simulation results [152] compared with experimental data by Fischer (red circle) [156], by Tran-Son-Tay et al. (red cross) [158], and Williamson et al. (green star) [155]. Linear fits for the experimental data of normal RBCs (red line) and diabetic RBCs (green line). Reproduced from reference [152] with permission. (b) Blood viscosity of normal and T2DM RBC suspension as a function of shear rate at a hematocrit of 45%. Simulation results (squares and triangles) [152] compared with experimental data (circles [144], crosses [161], and diamonds [162]). The red and green symbols are for the normal and diabetic RBC suspensions, respectively. Reproduced from reference [152] with permission. (c) Typical particle/platelet margination observed in blood flow from an in vitro study [163]. Reproduced from reference[163] with permission. (d) A DPD simulation of RBCs and platelets flowing in a circular channel showing an apparent cell-free layer (CFL).

Similar articles

Cited by

References

    1. Boal D.H. Mechanics of the Cell. Cambridge University Press; Cambridge, UK: 2012.
    1. Cooper G.M., Hausman R.E. The Cell: A Molecular Approach. Volume 2 Sinauer Associates; Sunderland, MA, USA: 2000.
    1. Steck T.L. The organization of proteins in the human red blood cell membrane: A review. J. Cell Biol. 1974;62:1. doi: 10.1083/jcb.62.1.1. - DOI - PMC - PubMed
    1. Mohandas N., Chasis J. Red blood cell deformability, membrane material properties and shape: Regulation by transmembrane, skeletal and cytosolic proteins and lipids. Semin. Hematol. 1993;30:171–192. - PubMed
    1. Li J., Lykotrafitis G., Dao M., Suresh S. Cytoskeletal dynamics of human erythrocyte. Proc. Natl. Acad. Sci. USA. 2007;104:4937–4942. doi: 10.1073/pnas.0700257104. - DOI - PMC - PubMed