. 2018 Aug 10;10(8):420.
doi: 10.3390/v10080420.

Influenza Virus Infection of Human Lymphocytes Occurs in the Immune Cell Cluster of the Developing Antiviral Response

Affiliations

Influenza Virus Infection of Human Lymphocytes Occurs in the Immune Cell Cluster of the Developing Antiviral Response

David J Mock et al. Viruses. .

Abstract

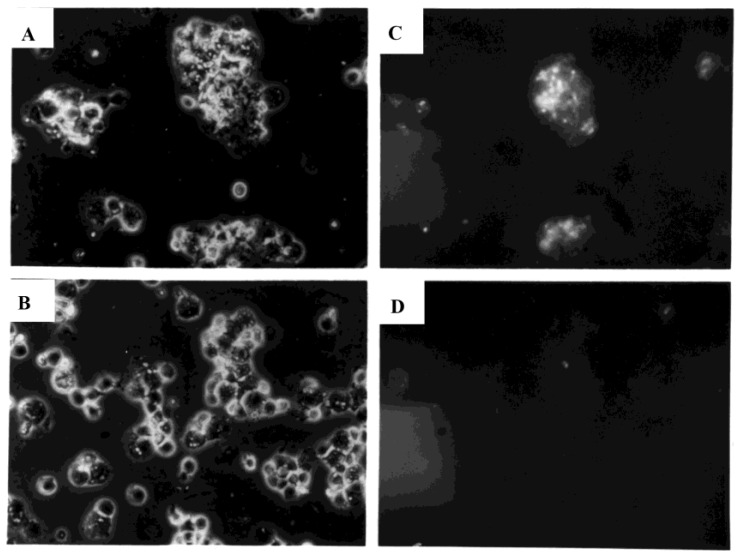
Monocytes-macrophages and lymphocytes are recruited to the respiratory tract in response to influenza virus challenge and are exposed to the virus during the establishment of immune defenses. The susceptibility of human lymphocytes to infection was assessed. The presence of monocytes-macrophages was required to attain infection of both resting and proliferating lymphocytes. Lymphocyte infection occurred in the context of immune cell clusters and was blocked by the addition of anti-intercellular adhesion molecule-1 (ICAM-1) antibody to prevent cell clustering. Both peripheral blood-derived and bronchoalveolar lymphocytes were susceptible to infection. Both CD4⁺ and CD8⁺ T lymphocytes were susceptible to influenza virus infection, and the infected CD4⁺ and CD8⁺ lymphocytes served as infectious foci for other nonpermissive or even virus-permissive cells. These data show that monocytes-macrophages and both CD4⁺ and CD8⁺ lymphocytes can become infected during the course of an immune response to influenza virus challenge. The described leukocyte interactions during infection may play an important role in the development of effective anti-influenza responses.

Keywords: alveolar lymphocytes; human lymphocytes; human macrophages; human monocytes; immune cell clusters; influenza virus.


Conflict of interest statement

The authors declare no conflict of interest.

Figures

Figure 1
Figure 1
Influenza virus infection of purified PBMC subpopulations. Autoradiograms of purified human lymphocytes (lanes 1–3) or monocytes-macrophages (lanes 4 and 5) which were sham-exposed or exposed to influenza A/AA/Marton/43 H1N1 (MOI = 1.0) are shown. Lanes 1 and 2 show lysates from lymphocytes sham-exposed or exposed in the absence of monocytes-macrophages, respectively. Lane 3 shows lysate from lymphocytes exposed to virus in the presence of macrophages, and then purified by elutriation before radiolabeling. Lanes 4 and 5 show lysates from sham-exposed or exposed monocytes-macrophages, respectively. Each lane represents lysate from 2 × 10⁶ cells. HA = hemagglutinin, at the 85 kD position; NA/NP = neuraminidase/nucleoprotein, which comigrate on SDS-PAGE, at the 60 kD position.
Figure 2
Figure 2
Influenza virus infection of purified PBMC subpopulations. Autoradiogram of proteins from purified human macrophages (lanes 1–4), total lymphocytes (lanes 5–8), and CD4+ (lanes 9 and 10) and CD8+ (lanes 11 and 12) T lymphocytes that were sham-exposed (controls, lanes 1, 2 and 5, 6) or exposed (all other lanes) to influenza virus are shown. Lymphocytes were exposed in the presence of macrophages (i.e., as PBMC) and then purified before radiolabeling, as described in Materials and Methods. Both immunoprecipitates using anti-hemagglutinin (HA), anti-neuraminidase (NA), anti-nucleoprotein (NP), and anti-matrix protein (M) antibodies (odd-numbered lanes) and total cell lysates (even-numbered lanes) are shown. Photographic exposure of the autoradiogram for lanes 9 to 12 was prolonged relative to the other lanes of the gel to permit illustration of the less intense bands of those lysates.
Figure 3
Figure 3
Influenza virus infection of purified lymphocyte subpopulations. Northern blot autoradiograms of lysates of CD4+ (lane 1) and CD8+ (lane 2) T lymphocytes are shown. The cells were exposed to influenza virus in the presence of monocytes-macrophages (that is, as PBMC) and then purified as described in Materials and Methods. Lysates were probed for influenza virus neuraminidase (NA) and the same lanes were probed subsequently for β-actin.
Figure 4
Figure 4
Cell size distributions (A,D) and cell cycle analyses (BF) of human lymphocytes cultured for three days after stimulation with inactivated influenza virus in the presence of <0.5% (AC) or 26% (DF) monocytes-macrophages (see protocol in Figure S3). Cells were then exposed to infectious influenza virus and analyzed and separated by elutriation into fractions enriched for small (▲ in (A,D)), resting (B,E) lymphocytes, and large (●, A,D), proliferating (C,F) lymphocytes. The horizontal axes of A and D indicate linear increments in size from 0 to 1220 μ3. Intermediate results were obtained using lymphocytes cultured in the presence of 11% monocytes-macrophages. Intermediate fractions of lymphocytes from each monocyte-macrophage-lymphocyte coculture, obtained immediately after changing elutriator settings and containing substantial mixtures of resting and proliferating lymphocytes, were discarded without further analysis.
Figure 5
Figure 5
Influenza virus infection of purified resting and proliferating lymphocytes. Autoradiograms of purified human lymphocytes that were sham-exposed (lane 1) or exposed to influenza virus (lanes 2–7) in the presence of autologous monocytes-macrophages are shown. The lymphocytes were then purified by elutriation before radiolabeling. The lymphocytes had been cocultured with varying proportions of monocytes-macrophages for three days after stimulation with inactivated influenza virus as follows: <0.5% monocytes-macrophages, lanes 2 and 3; 11% monocytes-macrophages, lanes 4 and 5; 26% monocytes-macrophages (equivalent to unseparated PBMC), lanes 1 (control), 6, and 7. Cells were then exposed to infectious influenza virus, followed by purification by elutriation, with separation into resting and proliferating fractions before radiolabeling. As with the other figures, each lane represents lysate from 2 × 10⁶ cells. Lanes 2, 4, and 6 show lysates from small resting lymphocytes (▲ in Figure S3 and Figure 4; >95% G0/G1). Lanes 3, 5, and 7 show lysates from lymphocytes enriched (>40%) for cells in S + G2/M (● in Figure S3 and Figure 4).
Figure 6
Figure 6
Cell cluster formation by sham-exposed and influenza virus-exposed PBMC (10× image). PBMC were sham-exposed (AD) or exposed to influenza virus (EH). Cultures were stained and examined by light microscopy at 40× after 1 h (A,E), 4 h (B,F), 24 h (C,G), and 72 h (D,H). Representative fields are shown.
Figure 7
Figure 7
Expression of influenza A hemagglutinin (HA) by PHA-stimulated human PBMC (40× image). Influenza virus (H1N1)-exposed PBMC (upper panels, (A,C)) and sham-exposed PBMC (lower panels, (B,D)) were examined by light (left panels) and fluorescence microscopy (right panels; same fields as left) after indirect immunofluorescent staining using influenza H1-specific polyclonal reference antisera. Cells were examined six hours after exposure to virus (MOI = 10).
Figure 8
Figure 8
Flow cytometric analysis of binding and internalization of FITC-labeled influenza virus by lymphocytes. Lymphocytes were exposed to virus in the absence (A,E and B,F) or presence (C,G and D,H) of monocytes-macrophages. Cells (104 per panel) were analyzed 2 h after exposure for green (AD) and red (EH) fluorescence in the absence (A,E and C,G) and presence (B,F and D,H) of ethidium bromide. Sequential upper and lower pairs of panels (for example, A,E and B,F) show results with the same population of cells analyzed before and after addition of ethidium bromide.
Figure 9
Figure 9
Cell cluster formation by PBMC exposed to FITC-labeled influenza virus (60× image). Cells were examined one hour after exposure to virus (MOI = 3) and examined by light (left panel) and fluorescence microscopy (right panel; same field as left) after addition of ethidium bromide to eliminate detection of green fluorescence associated with bound virus that is external to cell membranes.
Figure 10
Figure 10
Flow cytometric analysis of internalization of FITC-labeled influenza virus by lymphocytes exposed in the presence of monocytes-macrophages (i.e., as PBMC). PBMC were exposed to virus after pretreatment (▲) or sham pretreatment (isotype control, □) with antibody to ICAM-1. Results are shown for lymphocytes after addition of ethidium bromide to cultures to identify internalized (versus bound) virus.

Similar articles

Cited by

References

    1. Wyde P.R., Peavy D.L., Cate T.R. Morphological and Cytochemical Characterization of Cells Infiltrating Mouse Lungs After Influenza Infection. Infect. Immun. 1978;21:140–146. - PMC - PubMed
    1. Ennis F.A., Wells M.A., Butchko G.M., Albrecht P. Evidence That Cytotoxic T Cells Are Part of the Host’s Response to Influenza Pneumonia. J. Exp. Med. 1978;148:1241–1250. doi: 10.1084/jem.148.5.1241. - DOI - PMC - PubMed
    1. Cerwenka A., Morgan T.M., Dutton R.W. Naive, Effector, and Memory CD8 T Cells in Protection Against Pulmonary Influenza Virus Infection: Homing Properties Rather Than Initial Frequencies Are Crucial. J. Immunol. 1999;163:5535–5543. - PubMed
    1. Roman E., Miller E., Harmsen A., Wiley J., Von Andrian U.H., Huston G., Swain S.L. CD4 Effector T Cell Subsets in the Response to Influenza: Heterogeneity, Migration, and Function. J. Exp. Med. 2002;196:957–968. doi: 10.1084/jem.20021052. - DOI - PMC - PubMed
    1. Wyde P.R., Wilson M.R., Cate T.R. Interferon Production by Leukocytes Infiltrating the Lungs of Mice During Primary Influenza Virus Infection. Infect. Immun. 1982;38:1249–1255. - PMC - PubMed

Publication types

MeSH terms

LinkOut - more resources