

Incidence and prevalence of neuroendocrine tumors of the lung: analysis of a US commercial insurance claims database
- PMID: 30103725
- PMCID: PMC6088414
- DOI: 10.1186/s12890-018-0678-5
Incidence and prevalence of neuroendocrine tumors of the lung: analysis of a US commercial insurance claims database
Abstract
Background: As reported in Surveillance, Epidemiology, and End Results (SEER) data, US incidence and prevalence of neuroendocrine tumors (NET) has increased over recent years. The study objective was to update incidence and prevalence information for lung NET using administrative claims.
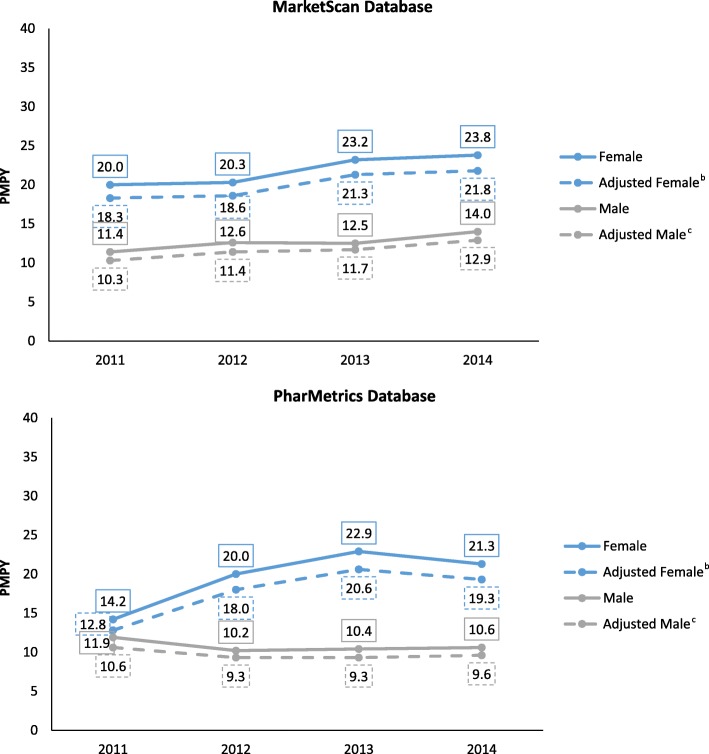
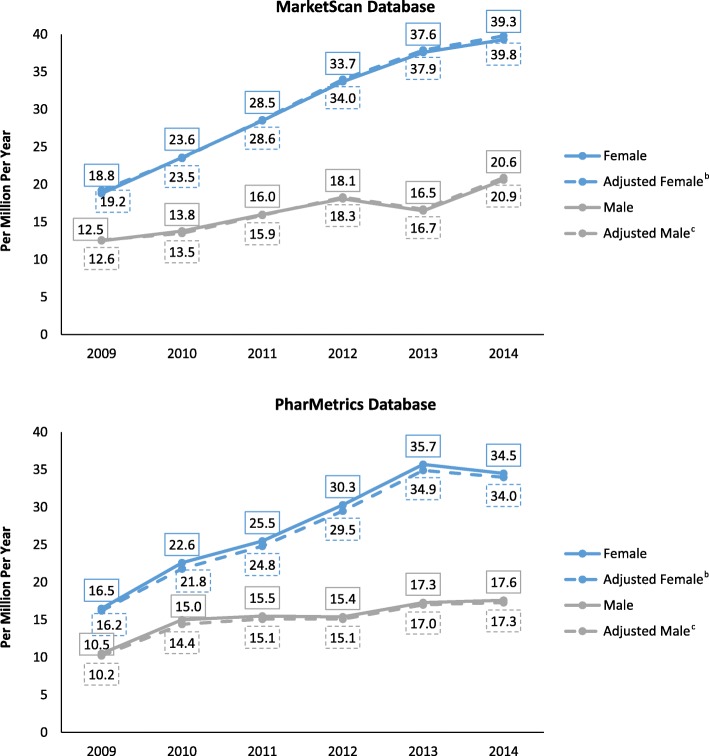
Methods: This descriptive epidemiological study used 2009-2014 data from 2 US claims databases: MarketScan and PharMetrics. Patients (18-64 years old) had ≥1 inpatient or ≥ 2 outpatient claims with NET of bronchus or lung, identified by International Classification of Diseases, 9th Revision, Clinical Modification diagnosis codes. Prevalence was number of lung NET patients divided by number of enrollees/year. Incidence was number of patients with a first observed NET diagnosis who were disease-free for 2 years prior, divided by number of enrollees. Age and gender adjustments performed.
Results: The annual number of patients with lung NET identified from 2009 to 2014 ranged from 435 to 796 (MarketScan) and 419-648 (PharMetrics). In MarketScan, there was a 7.4% (95%CI 2.1-13.0; p = 0.027) annual percent change (APC) in the age-adjusted incidence for males and 6.8% (- 0.2-14.3; 0.052) for females. In PharMetrics, APC was - 2.9% (- 13.8-9.4; 0.395) for males; 14.7% (- 12.9-51.2; 0.165) for females. In MarketScan, APC in age-adjusted prevalence for males was 9.9% (4.7-15.3; 0.006); 16.2% (11.4-21.1; <.001) for females. For PharMetrics, APCs were 9.5% (2.3-17.2; 0.021) for males; 16.3% (9.6-23.5; 0.002) for females.
Conclusions: From 2009 to 2014 there was a statistically significant increase in age-adjusted lung NET incidence for males in MarketScan, and a statistically significant increase in age-adjusted prevalence for both genders in PharMetrics. Incidence and prevalence changes, to the extent they exist, may be due to better diagnostic methods, increased awareness of NET among clinicians and pathologists, and/or an actual increase in US disease occurrence. Differences in rates across databases are difficult to explain. These results suggest the need for awareness of the clinically effective and safe treatment options available for lung NET patients among healthcare providers.
Keywords: Epidemiology; Incidence; Insurance claims; Lung neuroendocrine tumors; Prevalence.
Conflict of interest statement
Not applicable
Not applicable
BC and MPN are employees of Novartis. MB and EC are employees of Partnership for Health Analytic Research, a health services research firm paid by Novartis to conduct this research.
Springer Nature remains neutral with regard to jurisdictional claims in published maps and institutional affiliations.
Figures
References
MeSH terms
LinkOut - more resources
Full Text Sources
Other Literature Sources
Medical
Miscellaneous
