. 2018 Aug 14:7:e35314.
doi: 10.7554/eLife.35314.

The newly-arisen Devil facial tumour disease 2 (DFT2) reveals a mechanism for the emergence of a contagious cancer

Affiliations

The newly-arisen Devil facial tumour disease 2 (DFT2) reveals a mechanism for the emergence of a contagious cancer

Alison Caldwell et al. Elife. .

Abstract

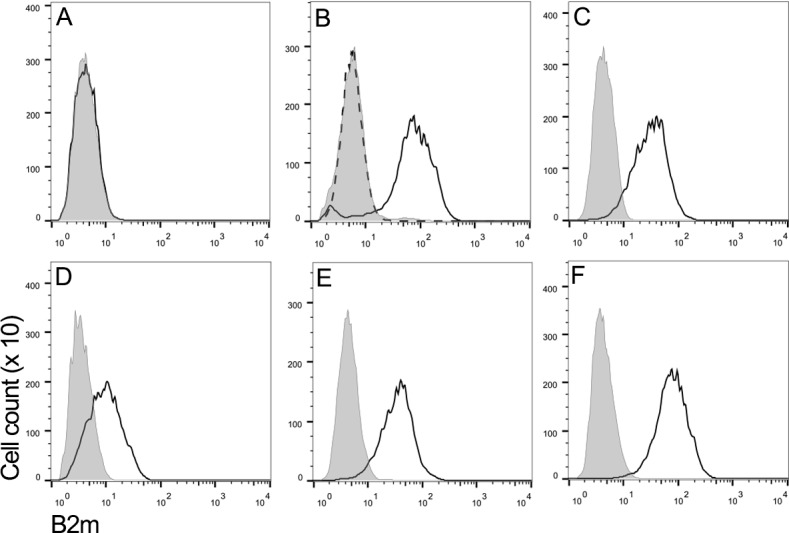
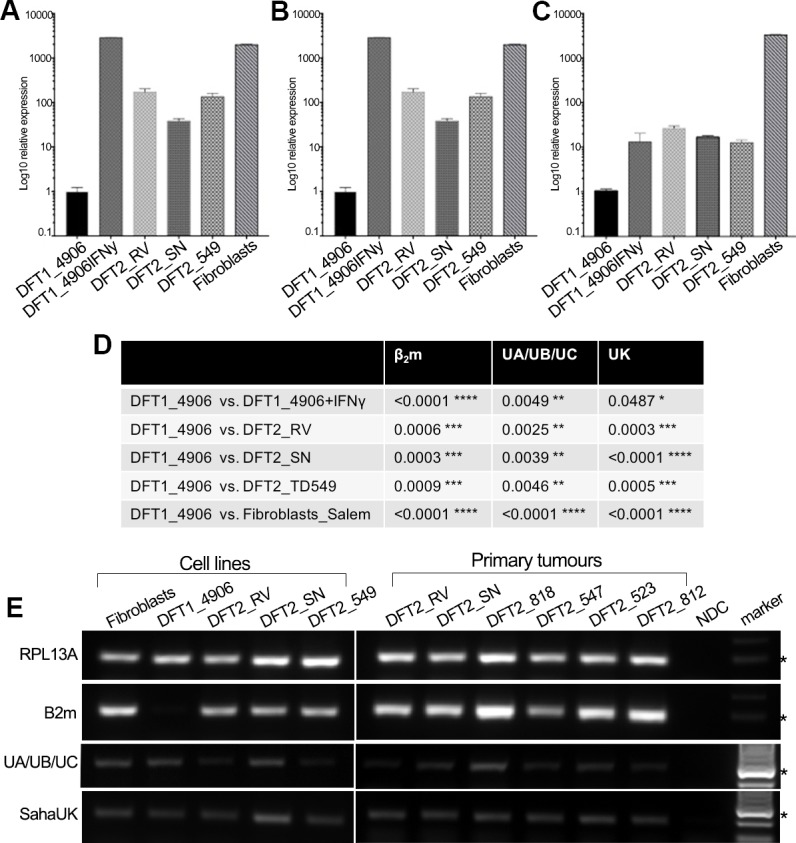
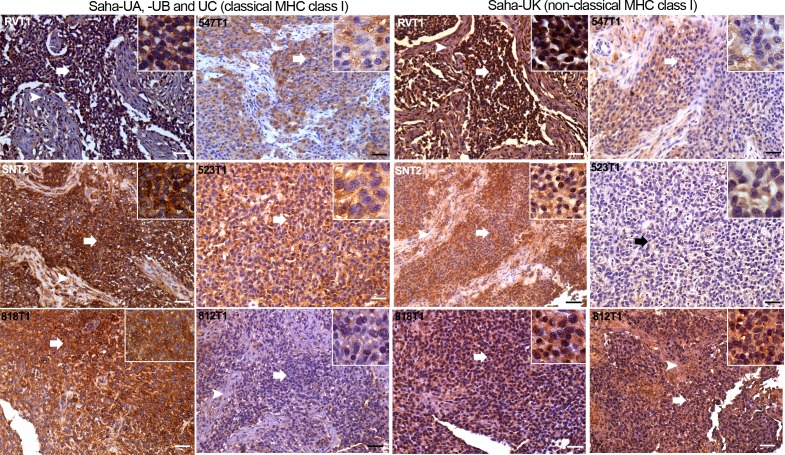
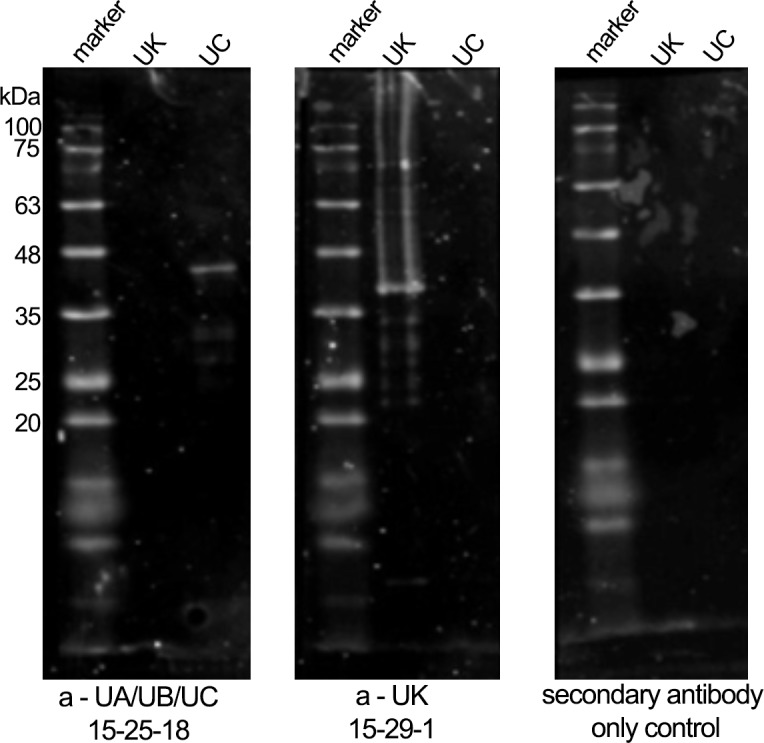
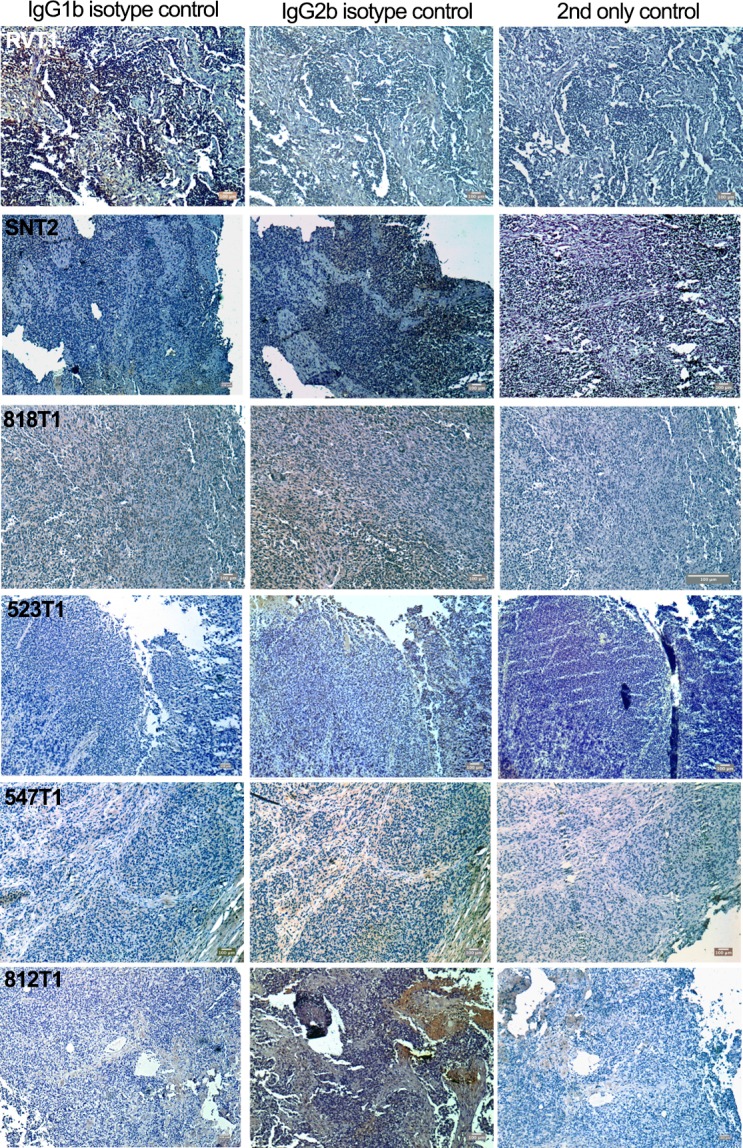
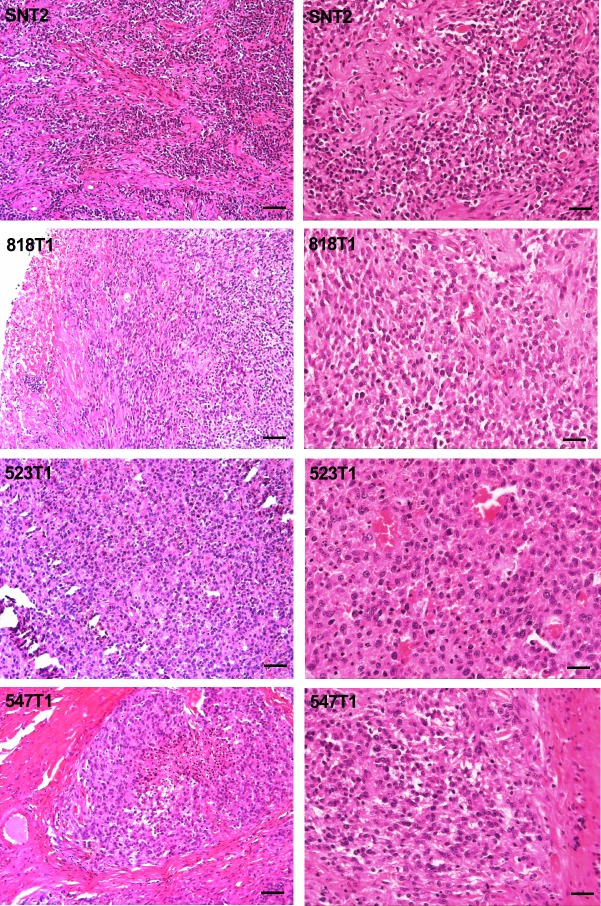
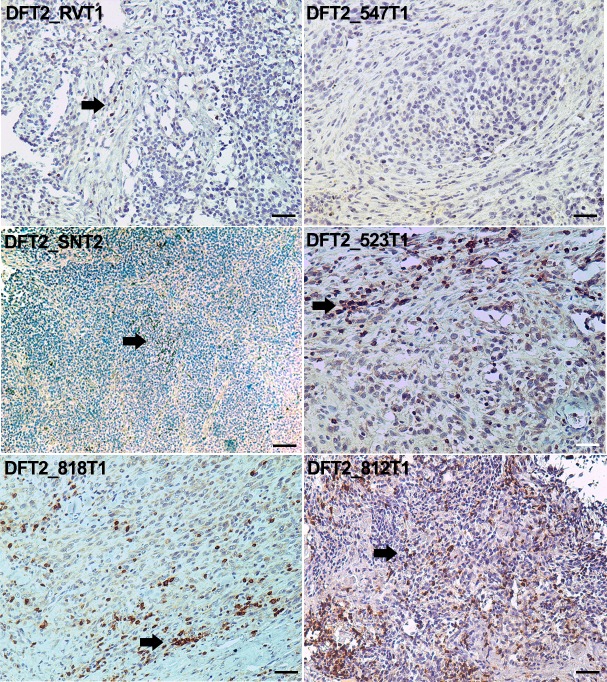
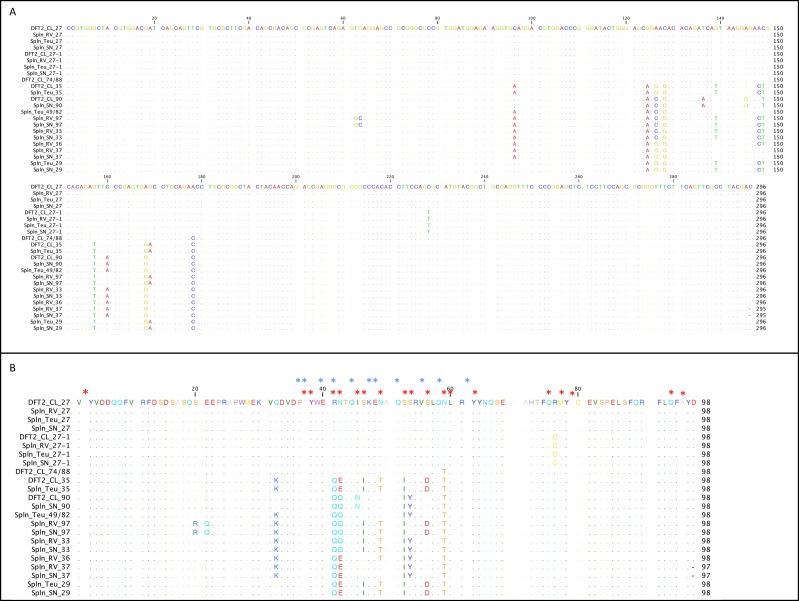
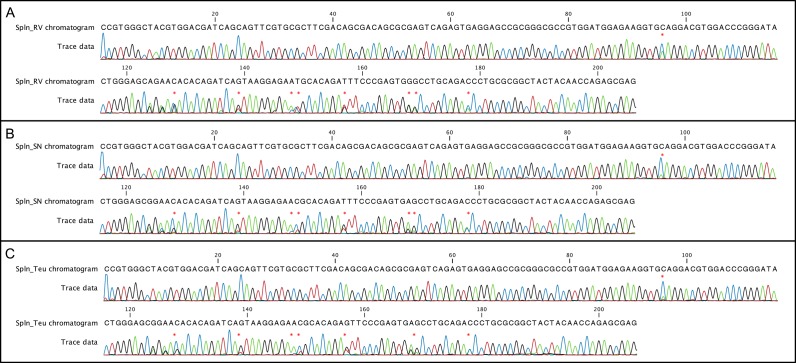
Devil Facial Tumour 2 (DFT2) is a recently discovered contagious cancer circulating in the Tasmanian devil (Sarcophilus harrisii), a species which already harbours a more widespread contagious cancer, Devil Facial Tumour 1 (DFT1). Here we show that in contrast to DFT1, DFT2 cells express major histocompatibility complex (MHC) class I molecules, demonstrating that loss of MHC is not necessary for the emergence of a contagious cancer. However, the most highly expressed MHC class I alleles in DFT2 cells are common among host devils or non-polymorphic, reducing immunogenicity in a population sharing these alleles. In parallel, MHC class I loss is emerging in vivo, thus DFT2 may be mimicking the evolutionary trajectory of DFT1. Based on these results we propose that contagious cancers may exploit partial histocompatibility between the tumour and host, but that loss of allogeneic antigens could facilitate widespread transmission of DFT2.

Keywords: MHC; Sarcophilus harrisii; cancer biology; contagious cancer; immune escape; immunology; inflammation.


Conflict of interest statement

AC, RC, CT, MS, YK, RO, MT, EM, KS, GT, JK, TE, GW, HS No competing interests declared

Figures

Figure 1.
Figure 1.. DFT2 cells express β2m in vitro.
Flow cytometry to compare β2m expression shows (A) DFT1_4906, (B) DFT1_4906 + IFNγ, (C) DFT2_RV, (D) DFT2_SN, (E) DFT2_TD549 and (F) Fibroblast_Salem cells stained with α-β2m (solid line) and secondary only control (shaded peak). DFT1_4906 + IFNγ (B) stained with blocked α-β2m antibody is also shown (dashed line). Fluorescence intensity for α-β2m on x-axis and cell counts on y-axis.
Figure 2.
Figure 2.. DFT2 cells in vitro and in vivo express mRNA for β2m, Saha-UK, Saha-UA, UB and UC.
RT-qPCR of (A) β2m, (B) Saha-UA, -UB and -UC and (C) Saha-UK mRNA expression by DFT2 cell lines (DFT2_RV, DFT2_SN, DFT2_TD549), fibroblast cells (Fibroblasts_Salem) and DFT1 cells treated with IFNγ (DFT1_4906 + IFNγ) relative to DFT1_4906 cells. Gene expression levels are normalized against RPL13A as a housekeeping gene. Data are represented as mean ± S.E.M of three technical replicates. (D) An unpaired T-test was performed to test for statistical significance. (E) RT-PCR on DFT2 cell lines and DFT2 primary tumours for β2m, Saha-UA, -UB and -UC and Saha-UK. RPL13A was used as a loading control. A no DNA control (NDC) is included for each RT-PCR. A marker at 300 base pairs is indicated by an asterisk.
Figure 2—figure supplement 1.
Figure 2—figure supplement 1.. RT-PCR amplification of RPL13A and Saha-UD from DFT1, DFT2 and Fibroblast cells.
mRNA from DFT1_4906, DFT1_4906 + IFNγ, DFT2_RV-CL, DFT2_SN-CL, DFT2_TD549-CL and Fibroblast_Salem cell lines was used. A no cDNA negative control was included in each experiment.
Figure 3.
Figure 3.. DFT2 tumours express variable levels of classical MHC class I (Saha-UA, -UB and -UC) and non-classical MHC class I (Saha-UK) in vivo.
IHC staining of DFT2 tumours (DFT2_RVT1, DFT2_SNT2, DFT2_818T1, DFT2_547T1, DFT2_523 DFT2_812) with α-UA/UB/UC_15-25-18 against Saha-UA, -UB and -UC and α-UK_15-29-1 against Saha-UK. Arrows indicate tumour cells for each biopsy; arrow heads indicate stroma separating nests of tumour cells where present. Isotype and secondary antibody controls can be found in Figure 3—figure supplement 2. Boxed insets are at 600 x magnification and are taken from areas indicated by arrows. Scale bars represent 50 μm. Positive cells for each marker are stained brown, nuclei are stained blue.
Figure 3—figure supplement 1.
Figure 3—figure supplement 1.. Western blots illustrating specificity of the MHC class I heavy-chain monoclonal antibodies.
Western blot on classical MHC class I protein (Saha-UC) (38 kDa) and non-classical MHC class I protein (Saha-UK) (39 kDa) with MHC class I heavy-chain specific antibodies.
Figure 3—figure supplement 2.
Figure 3—figure supplement 2.. Isotype controls (IgG1b – anti-SahaUA/UB/UC and IgG2b – anti-SahaUK) and secondary antibody only controls for the immunohistochemistry presented in Figure 3.
All images are 100 x magnification with scale bars represent 100 μm.
Figure 3—figure supplement 3.
Figure 3—figure supplement 3.. DFT2 tumours have different growth patterns.
H and E staining of four DFT2 tumours representing different growth patterns. Scale bars represent 100 μm.
Figure 4.
Figure 4.. CD3 staining of DFT2 tumours.
CD3 staining of DFT2_RVT1, DFT2_SNT2 DFT2_818T1, DFT2_TD547T1, DFT2_523T2 and DFT2_812 tumours. CD3 positive cells are indicated by arrows. DFT2_SNT2, and DFT2_547 are CD3 negative. Scale bars represent 50 μm. Positive cells for each marker are stained brown, nuclei are stained blue.
Figure 5.
Figure 5.. DFT2 shares classical MHC class I alleles with its hosts.
Alignment of the MHC class I sequences cloned from the mRNA from DFT2 cell lines (DFT2_CL) and host devils (TD_RV, TD_SN and TD_818 (Teu)). Nucleotide alignment in (A) and amino acid alignment in (B). Red asterisks indicate residues postulated to interact with peptides and blue asterisks indicate residues predicted to interact with TCRs (Bjorkman et al., 1987).
Figure 5—figure supplement 1.
Figure 5—figure supplement 1.. Chromatograms of α2-domian of MHC class I from spleen samples from RV, SN and 818/Teu.
Spln_RV, Spln_SN and Spln_818/Teu host tissues share the same polymorphic sites in the MHC class I α2-domian. Chromatograms of α2-domian of MHC class I (Saha-UA, -UB and –UC) from spleen samples from RV, SN and 818/Teu from PCR amplification and sequencing using the reverse primer Saha91. Polymorphic sites are indicated by an asterisk.

Comment in

  • A 'devil' of a problem.
    Hansen VL, Miller RD. Hansen VL, et al. Elife. 2018 Aug 14;7:e39976. doi: 10.7554/eLife.39976. Elife. 2018. PMID: 30103857 Free PMC article.

References

    1. Adams EJ, Parham P. Species-specific evolution of MHC class I genes in the higher primates. Immunological Reviews. 2001;183:41–64. doi: 10.1034/j.1600-065x.2001.1830104.x. - DOI - PubMed
    1. Almand B, Clark JI, Nikitina E, van Beynen J, English NR, Knight SC, Carbone DP, Gabrilovich DI. Increased production of immature myeloid cells in cancer patients: a mechanism of immunosuppression in cancer. The Journal of Immunology. 2001;166:678–689. doi: 10.4049/jimmunol.166.1.678. - DOI - PubMed
    1. Bjorkman PJ, Saper MA, Samraoui B, Bennett WS, Strominger JL, Wiley DC. Structure of the human class I histocompatibility antigen, HLA-A2. Nature. 1987;329:506–512. doi: 10.1038/329506a0. - DOI - PubMed
    1. Braud VM, Allan DS, McMichael AJ. Functions of nonclassical MHC and non-MHC-encoded class I molecules. Current Opinion in Immunology. 1999;11:100–108. doi: 10.1016/S0952-7915(99)80018-1. - DOI - PubMed
    1. Chee SJ, Lopez M, Mellows T, Gankande S, Moutasim KA, Harris S, Clarke J, Vijayanand P, Thomas GJ, Ottensmeier CH. Evaluating the effect of immune cells on the outcome of patients with mesothelioma. British Journal of Cancer. 2017;117:1341–1348. doi: 10.1038/bjc.2017.269. - DOI - PMC - PubMed

Publication types

Substances