

Diffusion of Ca2+ from Small Boutons en Passant into the Axon Shapes AP-Evoked Ca2+ Transients
- PMID: 30103908
- PMCID: PMC6170794
- DOI: 10.1016/j.bpj.2018.07.018
Diffusion of Ca2+ from Small Boutons en Passant into the Axon Shapes AP-Evoked Ca2+ Transients
Abstract
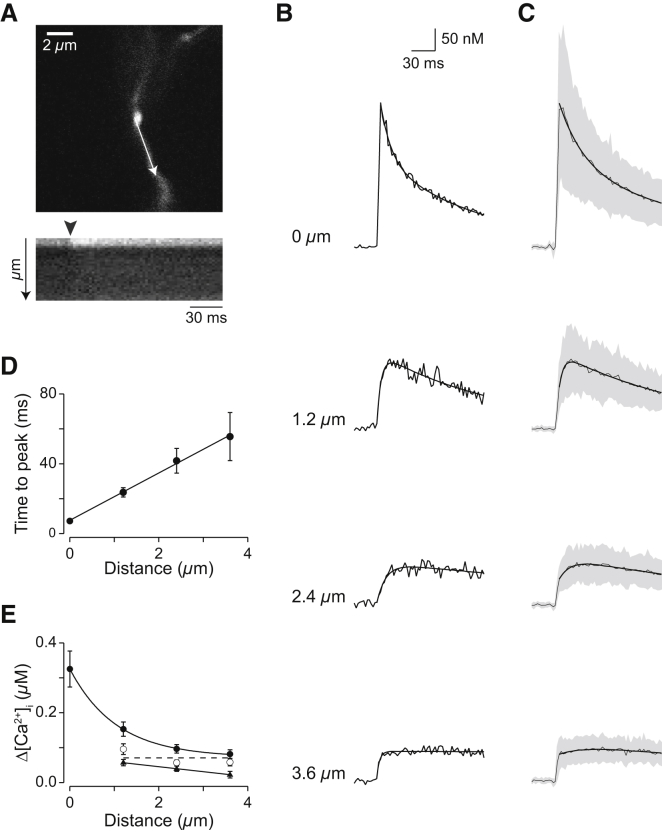
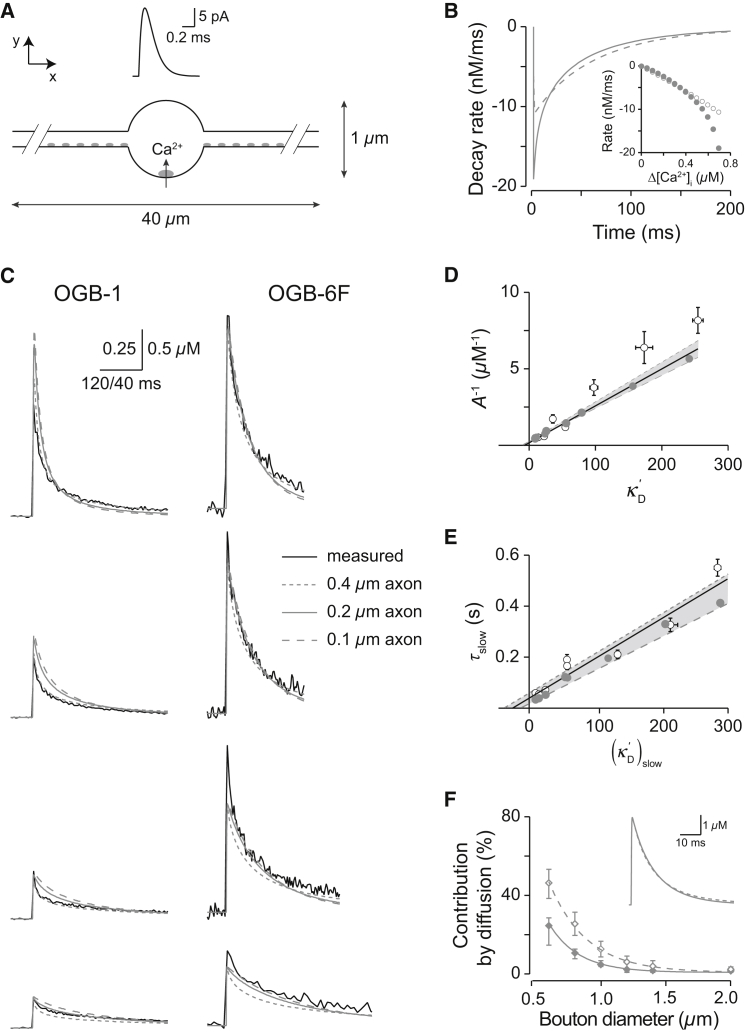
Not only the amplitude but also the time course of a presynaptic Ca2+ transient determine multiple aspects of synaptic transmission. In small bouton-type synapses, the mechanisms underlying the Ca2+ decay kinetics have not been fully investigated. Here, factors that shape an action-potential-evoked Ca2+ transient were quantitatively studied in synaptic boutons of neocortical layer 5 pyramidal neurons. Ca2+ transients were measured with different concentrations of fluorescent Ca2+ indicators and analyzed based on a single-compartment model. We found a small endogenous Ca2+-binding ratio (7 ± 2) and a high activity of Ca2+ transporters (0.64 ± 0.03 ms-1), both of which enable rapid clearance of Ca2+ from the boutons. However, contrary to predictions of the single-compartment model, the decay time course of the measured Ca2+ transients was biexponential and became prolonged during repetitive stimulation. Measurements of [Ca2+]i along the adjoining axon, together with an experimentally constrained model, showed that the initial fast decay of the Ca2+ transients predominantly arose from the diffusion of Ca2+ from the boutons into the axon. Therefore, for small boutons en passant, factors like terminal volume, axon diameter, and the concentration of mobile Ca2+-binding molecules are critical determinants of Ca2+ dynamics and thus Ca2+-dependent processes, including short-term synaptic plasticity.
Copyright © 2018 Biophysical Society. Published by Elsevier Inc. All rights reserved.
Figures
Comment in
-
Presynaptic Calcium En Passage through the Axon.Biophys J. 2018 Oct 2;115(7):1143-1145. doi: 10.1016/j.bpj.2018.08.022. Epub 2018 Aug 27. Biophys J. 2018. PMID: 30217379 Free PMC article. No abstract available.
Similar articles
-
Calcium dynamics associated with action potentials in single nerve terminals of pyramidal cells in layer 2/3 of the young rat neocortex.J Physiol. 2000 Dec 15;529 Pt 3(Pt 3):625-46. doi: 10.1111/j.1469-7793.2000.00625.x. J Physiol. 2000. PMID: 11118494 Free PMC article.
-
Neuromodulation at single presynaptic boutons of cerebellar parallel fibers is determined by bouton size and basal action potential-evoked Ca transient amplitude.J Neurosci. 2009 Dec 9;29(49):15586-94. doi: 10.1523/JNEUROSCI.3793-09.2009. J Neurosci. 2009. PMID: 20007482 Free PMC article.
-
Differences in Ca2+ regulation for high-output Is and low-output Ib motor terminals in Drosophila larvae.Neuroscience. 2009 Apr 10;159(4):1283-91. doi: 10.1016/j.neuroscience.2009.01.074. Epub 2009 Feb 7. Neuroscience. 2009. PMID: 19409207
-
Dynamic Factors for Transmitter Release at Small Presynaptic Boutons Revealed by Direct Patch-Clamp Recordings.Front Cell Neurosci. 2019 Jun 12;13:269. doi: 10.3389/fncel.2019.00269. eCollection 2019. Front Cell Neurosci. 2019. PMID: 31249514 Free PMC article. Review.
-
Spatial and temporal aspects of neuronal calcium and sodium signals measured with low-affinity fluorescent indicators.Pflugers Arch. 2024 Jan;476(1):39-48. doi: 10.1007/s00424-023-02865-1. Epub 2023 Oct 6. Pflugers Arch. 2024. PMID: 37798555 Review.
Cited by
-
The potassium channel subunit Kvβ1 serves as a major control point for synaptic facilitation.Proc Natl Acad Sci U S A. 2020 Nov 24;117(47):29937-29947. doi: 10.1073/pnas.2000790117. Epub 2020 Nov 9. Proc Natl Acad Sci U S A. 2020. PMID: 33168717 Free PMC article.
-
Presynaptic Calcium En Passage through the Axon.Biophys J. 2018 Oct 2;115(7):1143-1145. doi: 10.1016/j.bpj.2018.08.022. Epub 2018 Aug 27. Biophys J. 2018. PMID: 30217379 Free PMC article. No abstract available.
-
Presynaptic vesicles supply membrane for axonal bouton enlargement during LTP.bioRxiv [Preprint]. 2025 May 2:2025.04.29.651313. doi: 10.1101/2025.04.29.651313. bioRxiv. 2025. PMID: 40654927 Free PMC article. Preprint.
References
Publication types
MeSH terms
Substances
LinkOut - more resources
Full Text Sources
Other Literature Sources
Research Materials
Miscellaneous
